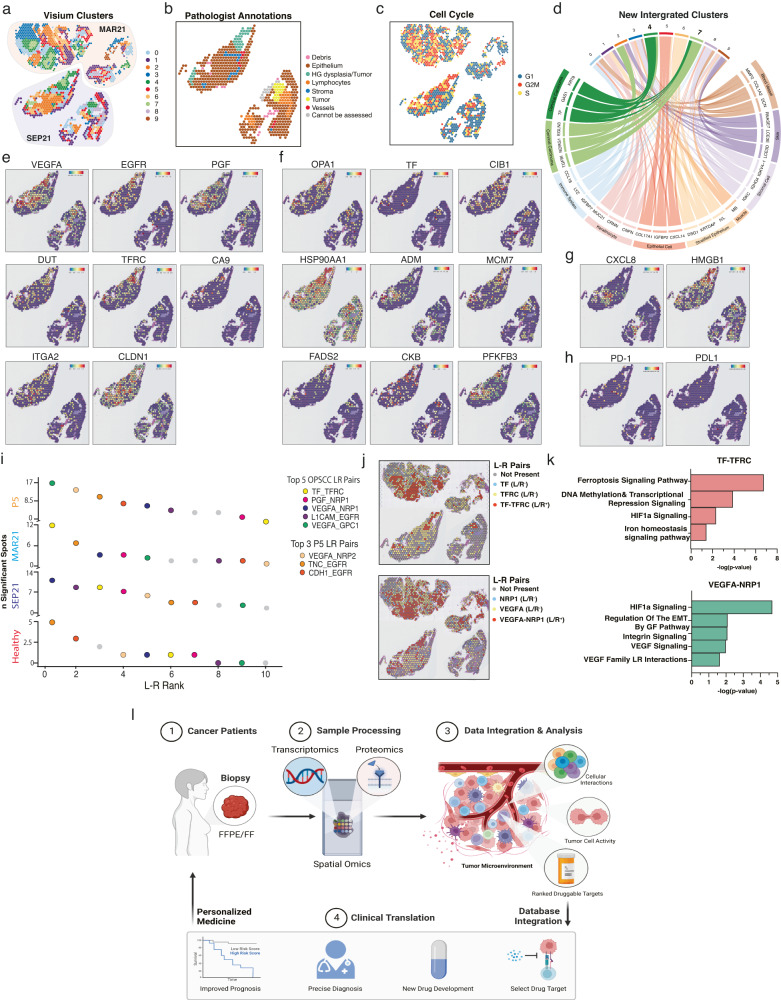
Fig. 3. Transcriptional comparison between MAR21 and recurrent SEP21 and ligand-receptor interaction analysis for therapeutic target selection.
a Spatial representation of unsupervised clusters identified between integrated tumor samples. MAR21 highlighted in red shades and recurrent tumor SEP21 highlighted in blue shades. b Annotated cell cycle phase of each spot based on relative expression of specific cell phase genes. c Pathologist annotations of SEP21, defining general tissue structures including epithelium (brown), dysplastic tissue (light green), and tumor (yellow). d Chord diagram displays genetic correlation between new clusters corresponding to integration of the MAR21 and SEP21. Comparisons were based on gene expression levels of the top 3 upregulated genes expressed by each original MAR21 cluster (only one muscle gene was found in the new cluster) within each new cluster. Connecting ribbons define the correlation between original and new clusters which significantly over-express each gene. e Spatial expression of genes across each spot targeted by current clinical therapies. f Spatial expression of genes targeted by select experimental drug therapies. g Spatial expression of genes targeted by select experimental drug therapies only seen in SEP21 samples. h Spatial representation of gene expression for Nivolumab and Pembrolizumab targeted PD-1/PD-L1 pathway. In all feature plots, the relative gene expression per spot is indicated by the colored scale bars. i Ranking of top 35 ligand/receptor (L-R) pairs targeted by clinical and experimental therapies expressed by the healthy (red), MAR21 (light blue) recurrent SEP21 (dark blue), and additional patient (orange) samples. Rank was based on the number of significant spots expressing each L-R pair across each sample. Colors indicate the location of each specific LR pair. Orange spots represent the top 3 L-R pairs specific to the additional sample. j Spatial localization of ligand and receptor expression across tumor tissues (top: MAR21, bottom: SEP21). Red spots indicate co-expression of both ligand and receptor within the same spot. k Significantly active IPA pathways associated with expression of the top two ranked L-R pairs (TF/TFRC and VEGFA/NRP1). Bars indicate negative-log right-tailed Fisher’s Exact Test p-values of each pathway based on the proportion of genes within each canonical pathway that were also significantly up- or down-regulated within spots co-expressing both L-R pairs. l Infographic representing the proposed protocol to incorporate spatial multi-omics within a clinical setting. Image generated with Biorender.

