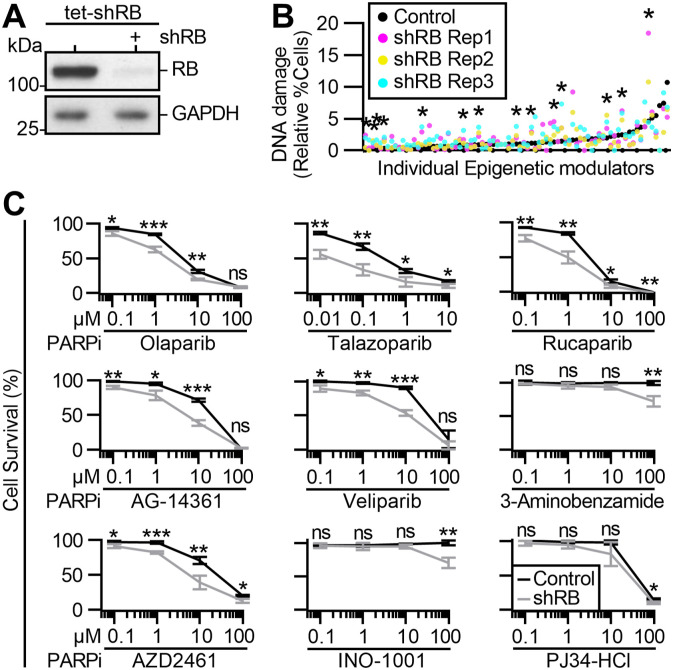
Figure 1. Identification of epigenetic sensitivities of RB-deficient cells.
(A) Western blot analysis of cells with and without 96 h induced expression of an RB-targeting shRNA (tet-shRB). (B) Fraction of control (black) and shRB (magenta, yellow, and cyan) cells with DNA damage after 48 h of exposure to individual epigenetic modulators. * indicates differential increase in DNA damage in RB-deficient cells with robust Z score > 3. (C) Relative cell survival of control and shRB cells, as indicated by metabolic color conversion of PrestoBlue reagent after incubation with the indicated PARP inhibitors and concentrations. All experiments and statistics calculated between independent experiments performed in triplicate. Error bars represent SD between replicates. (*) P < 0.05; (**) P < 0.01; (***) P < 0.001; (ns) nonsignificant P > 0.05.

