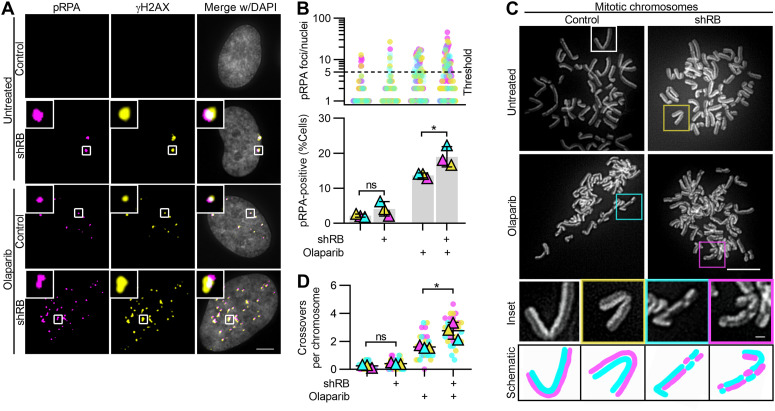
Figure 4. DNA damage accumulates at sites of replication stress after combined PARP trapping and RB depletion.
(A, B) Representative images and quantification of pRPA and γH2AX foci in RPE tet-shRB cells with (shRB) or without (control) doxycycline induction of shRB, after 48 h incubation with Olaparib, as indicated. Scale bar is 5 μm. (B) shows number of pRPA foci per cell (top) and percent of cells with ≥5 damage foci (bottom). Experiments were performed and statistics calculated between independent experiments performed in triplicate. Error bars represent SD between replicates. (C, D) Representative images and quantification of mitotic crossover events in RPE tet-shRB cells stained with acridine orange. Cells were cultured in 15 μM BrdU for 48 h and incubated with olaparib, as indicated, for the final 24 h before fixation. Scale bar is 10 μm. Insets represents 4x enlargements of a single chromosome, with 1 μm scale bar. Diagrams illustrate crossover events present in the inset. Independent experiments were performed in triplicate. Statistics were performed between the average number of crossover events per replicate (*) P < 0.05; (ns) nonsignificant P > 0.05.

