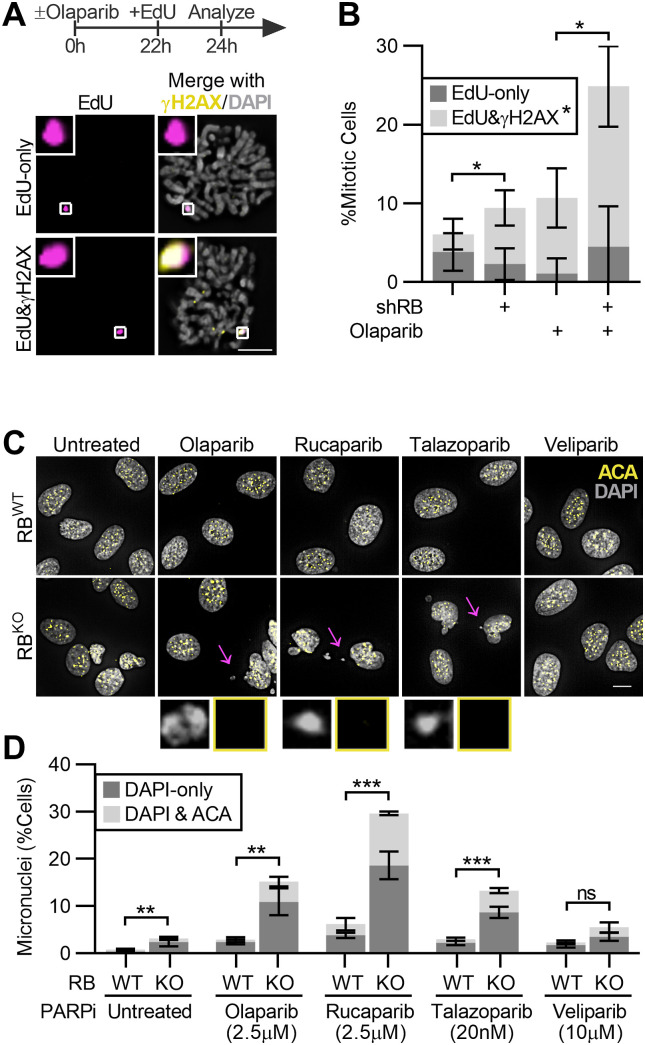
Figure 5. Continued proliferation of RB-deficient cells in the presence of PARP trapping promotes genome instability.
(A, B) Representative images and quantification of EdU and γH2AX foci in mitotic RPE tet-shRB cells with (shRB) or without (control) doxycycline induction of shRB, incubated with 2.5 μM olaparib for 24 h, and cultured in 10 μM EdU for 2 h before fixation. Images and analysis reflect analysis of mitotic cells. Scale bar is 10 μm. Error bars represent SD between three independent experimental replicates. Statistical analysis was performed for co-localized γH2AX and EdU foci, between replicates. (C, D) Representative images and quantification of the fraction of control (RBWT) and RB-null (RBKO) cells with micronuclei after incubation with the indicated PARP inhibitors for 48 h. Insets highlight micronuclei indicated by the arrow. Scale bar is 20 μm. Error bars represent SD between three independent experimental replicates and statistical analysis is performed between replicates. (*) P < 0.05; (**) P < 0.01; (***) P < 0.001; (ns) nonsignificant P > 0.05.

