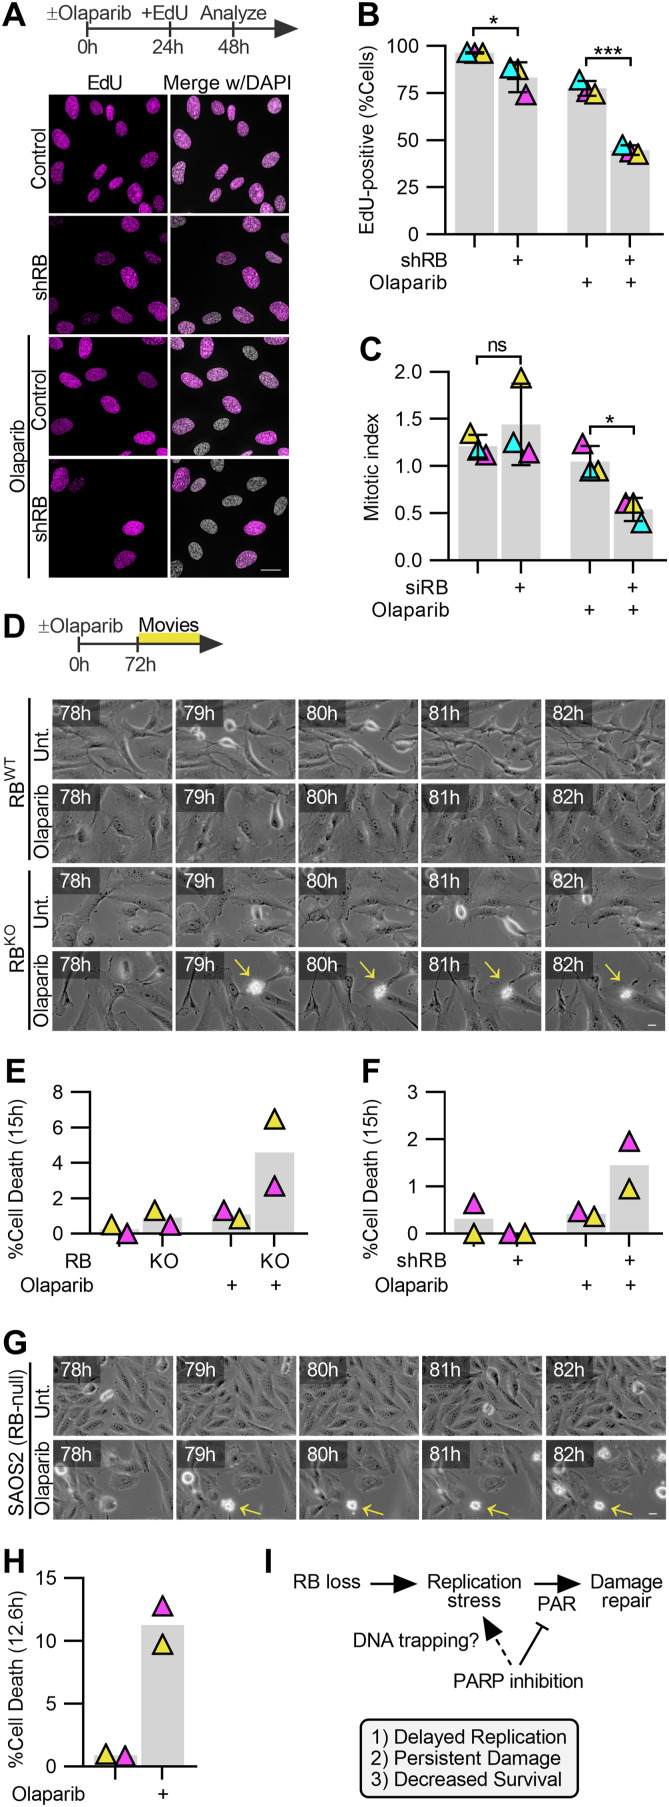
Figure 6. PARP trapping synergizes with RB loss to compromise cell viability.
(A, B) Representative images and quantification of replication-competent RPE tet-shRB cells with (shRB) or without (control) doxycycline induction of shRB, after incubation with 2.5 μM olaparib for 48 h. Cells were incubated with 10 μM EdU for the final 24 h before fixation. Scale bar is 20 μm. (C) Quantification of the fraction of RPE cell populations in mitosis after siRNA-based depletion of RB, then incubation in 2.5 μM olaparib for 48 h. Error bars represent the SD between three independent experimental replicates. Statistical analysis was performed between replicates. (D, E, F, G, H) Representative still frames and quantification of cell death from live cell imaging of control (RBWT) and RB-null (RBKO) cells, (F) in RPE tet-shRB cells with (shRB) or without (control) doxycycline induction of shRB, and (G, H) RB1-null SAOS2 osteosarcoma cells incubated with or without olaparib. Scale bars are 20 μm. Timestamps indicate time since PARP inhibitor addition. Live cell imaging was performed in duplicate. (*) P < 0.05; (***) P < 0.001; (ns) nonsignificant P > 0.05. (I) model of the proposed mechanism underlying replication stress, DNA damage, and reduced viability in Rb-deficient cells after PARP trapping.

