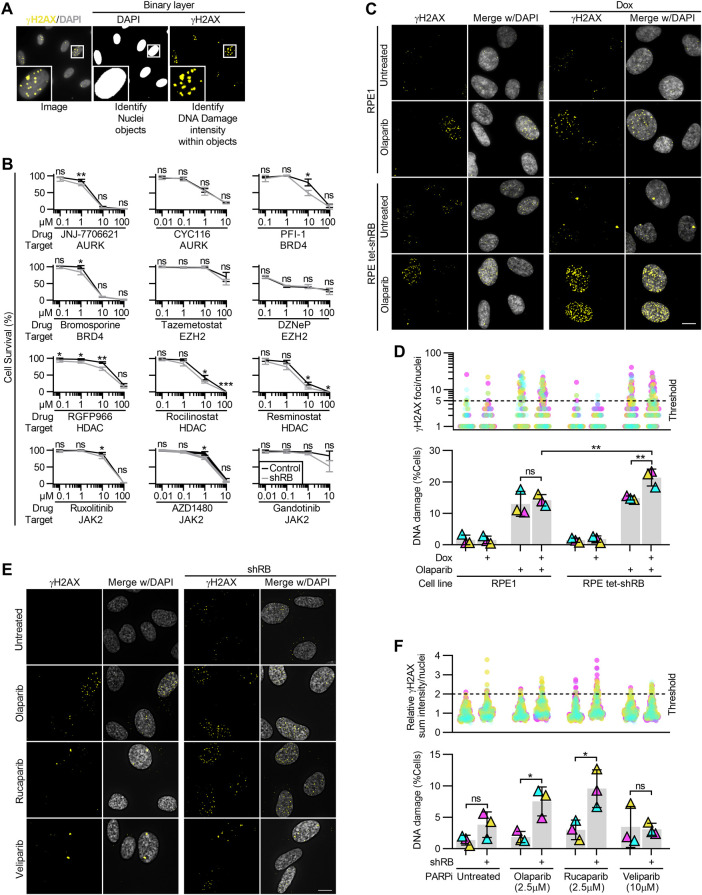
Figure S1. Acute depletion of RB renders cells sensitive to a panel of PARP1/2 inhibitors.
(A) Visualization of NIS-Elements analysis indicating nuclei segmentation and DNA damage identification based on γH2AX staining intensity. (B) Relative cell survival indicated by metabolic color conversion of PrestoBlue reagent, in RPE tet-shRB cells with and without 2 μg/ml doxycycline induced shRB expression, after incubation with the indicated PARP inhibitors and concentrations. (C, D) Representative images and quantification of γH2AX foci in RPE1 and RPE tet-shRB cells with and without 2 μg/ml doxycycline, after 48 h of incubation with the PARP inhibitor 2.5 μM olaparib, as indicated (+). (D) shows the number of γH2AX foci per cell (top) and percent of cells with ≥5 damage foci (bottom). (E, F) Representative images and quantification of γH2AX staining intensity in control and shRB cells, after 48 h incubation with PARP inhibitors, as indicated. (F) shows γH2AX staining intensity per cell normalized to the average value of untreated controls per replicate (top) and percent of cells with ≥twice the average γH2AX staining intensity of untreated controls (bottom). Scale bars are 10 μm. Error bars represent SD and statistics are calculated between three independent experimental replicates. Data in (D) were statistically analyzed using two-way ANOVA and Tukey’s multiple comparisons test. (*) P < 0.05; (**) P < 0.01; (***) P < 0.001; (ns) nonsignificant P > 0.05.

