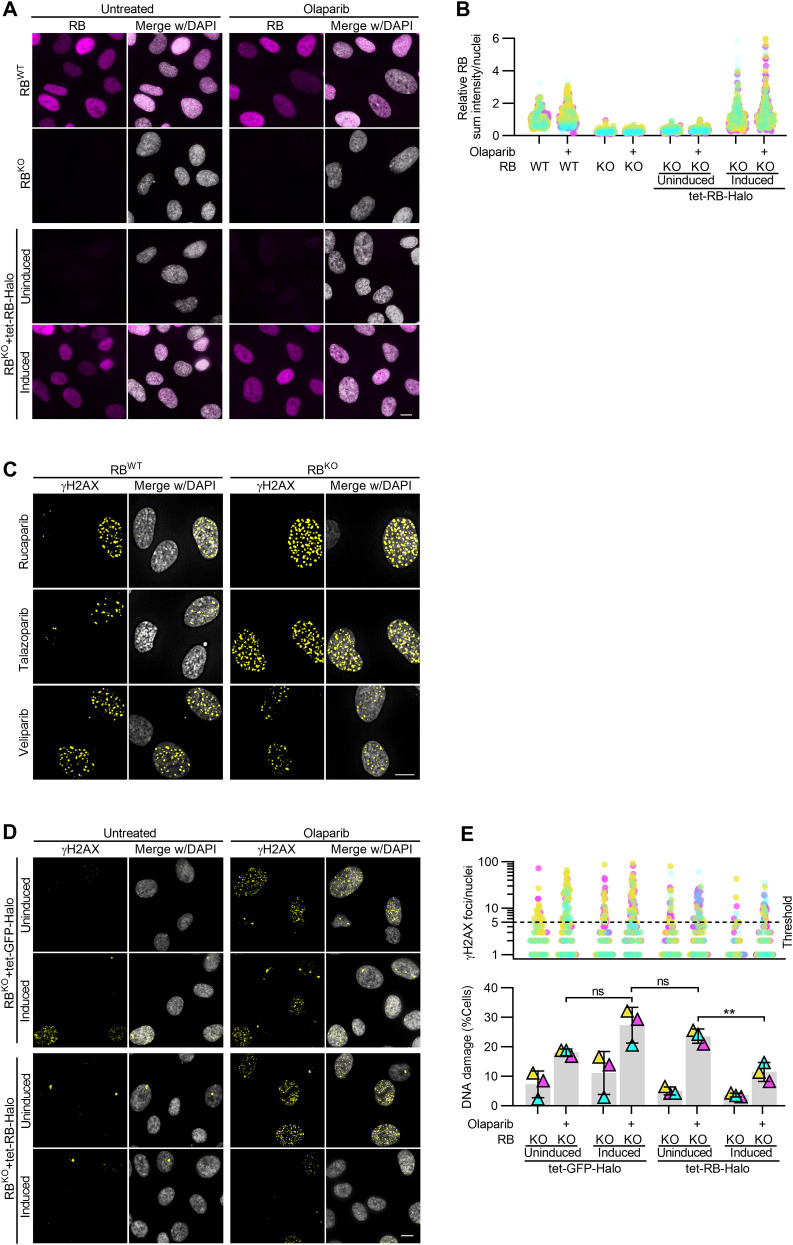
Figure S2. Exogenous expression of RB-Halo in RB-null RPE cells rescues PARP trapper sensitivity.
(A, B) Representative images and quantification of RB levels in control (RBWT) and RB-null (RBKO) RPE cells with and without 2 μg/ml doxycycline-induced expression of Halo-tagged RB (RB-Halo), after incubation with 2.5 μM olaparib for 48 h as indicated (+). (C) Representative images of γH2AX foci in RBWT and RBKO RPE cells incubated with PARP inhibitors 2.5 μM rucaparib, 20 nM talazoparib or 10 μM veliparib for 48 h. Quantification is in Fig 2D. (D, E) Representative images and quantification of γH2AX foci in RBKO RPE cells expressing tet-GFP-Halo or tet-RB-Halo, after 2 μg/ml doxycycline induced expression of the respective tet-Halo constructs, and 48 h incubation with PARP inhibitor 2.5 μM olaparib, as indicated (+). (E) shows number of γH2AX foci per cell (top) and percent of cells with ≥5 damage foci (bottom). Scale bars are 10 μm. Three independent replicates were performed for each experiment. Data in (E) were statistically analyzed using two-way ANOVA and Tukey’s multiple comparisons test. (**) P < 0.01; (ns) nonsignificant P > 0.05.

