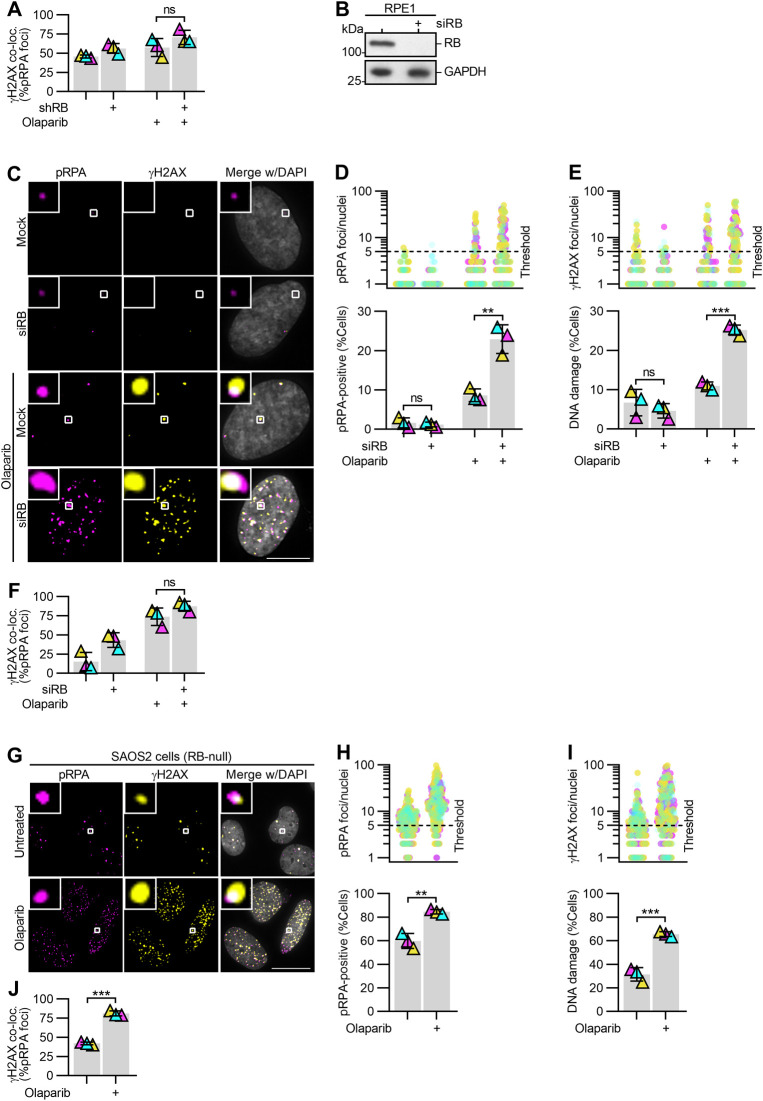
Figure S4. PARP trapping after acute and constitutive loss of RB similarly promote replication-associated DNA damage.
(A) Quantification of colocalization of γH2AX and pRPA foci for experiments described in Fig 4A and B. (B) Western blot analysis of RB protein levels following transfection with mock (control) or RB-targeting siRNA pool (siRB). (C, D, E, F) Representative images and quantification of pRPA and γH2AX foci in mock or siRB-transfected RPE cells, after 48 h of incubation with 2.5 μM Olaparib, as indicated (+). Scale bar is 10 μm. (D, E) show number of pRPA or γH2AX foci per cell (top) and percent of cells with ≥5 damage foci (bottom). (C, D, E, F) Quantification of co-localization of γH2AX and pRPA foci for experiments in C, D, E. (G, H, I, J) Representative images and quantification of pRPA and γH2AX foci in RB-null SAOS2 osteosarcoma cells, after 48 h incubation with 10 μM olaparib as indicated (+). Scale bar is 20 μm. (H, I) show the number of pRPA or γH2AX foci per cell (top) and percent of cells with ≥5 damage foci (bottom). (G, H, I, J) Quantification of co-localization of γH2AX and pRPA foci for experiments in G, H, I. Error bars represent SD and statistics were performed between three independent experimental replicates. (**) P < 0.01; (***) P < 0.001; (ns) non-significant P > 0.05.

