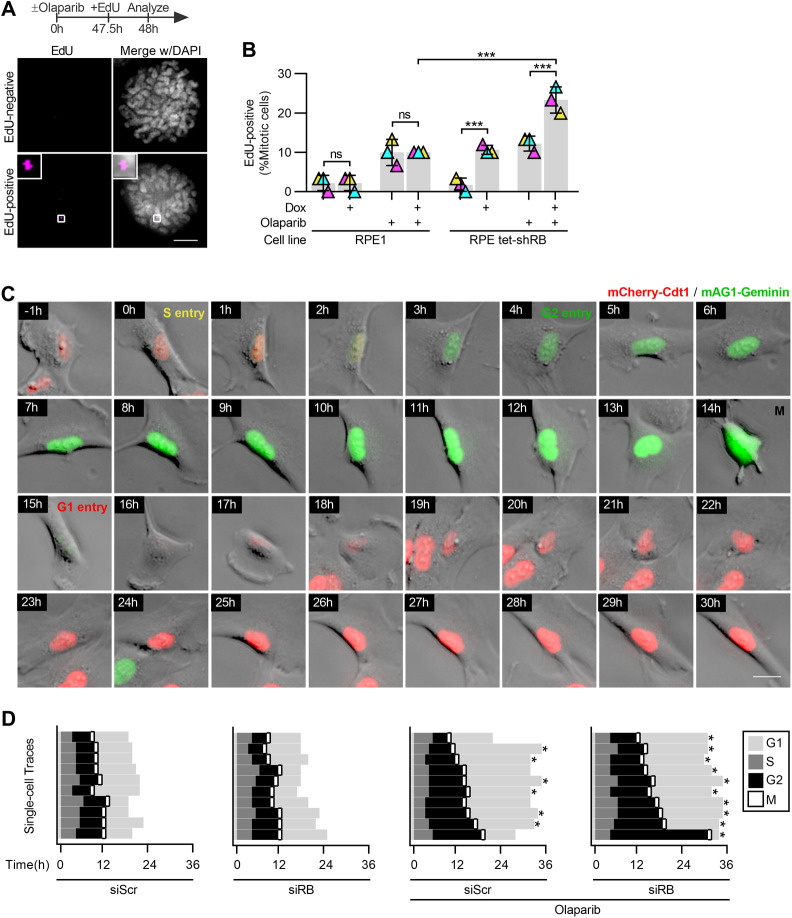
Figure S5. PARP trapping synergizes with RB loss to compromise cell cycle progression.
(A, B) Representative images and quantification of EdU foci in mitotic RPE1 and RPE tet-shRB cells with or without 2 μg/ml doxycycline induction of shRB, incubated with 2.5 μM olaparib for 48 h, as indicated (+), and cultured in 10 μM EdU for 30 min before fixation. Scale bar is 5 μm. Error bars represent the SD and two-way ANOVA and Tukey’s multiple comparisons test. (***) P < 0.001; (ns) nonsignificant P > 0.05, performed between three independent experimental replicates. (C, D) Representative still frames and quantification of cell cycle progression from live cell imaging of control (siScr) and RB-depleted (siRB) RPE FUCCI cells incubated with 2.5 μM olaparib as indicated. Cells were traced from the end of the first G1-phase until the end of the second G1-phase or until the movie ended (*). (C) shows a representative RB-depleted, olaparib-treated cell. Timestamps indicate time after S phase entry. Scale bar is 20 μm.

