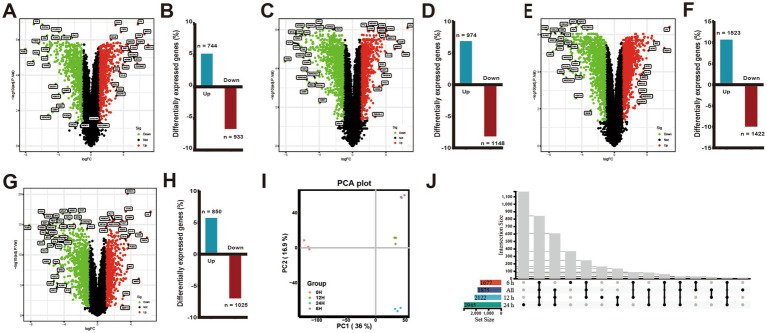
Figure 1.
Changes in differential gene expression in PAMs at different times after ASFV infection. (A,C,E,G) Volcano plots showing fold changes and adjusted p-values for genes differentially expressed between unstimulated (mock) and ASFV-stimulated PAMs at 6, 12, and 24 h.p.i., respectively. (B,D,F,H) The upregulated/downregulated and the total number of DEGs (≥2 FC, p < 0.05) between unstimulated (mock) and ASFV-stimulated PAMs in the transcriptomic data at 6, 12, and 24 h, respectively. (I) The principal component analysis (PCA). (J) Venn diagrams show an overlap of ASFV-induced DEGs across 6, 12, 24 h.p.i. and the integrated data of the three time points.

