
Figure 3.
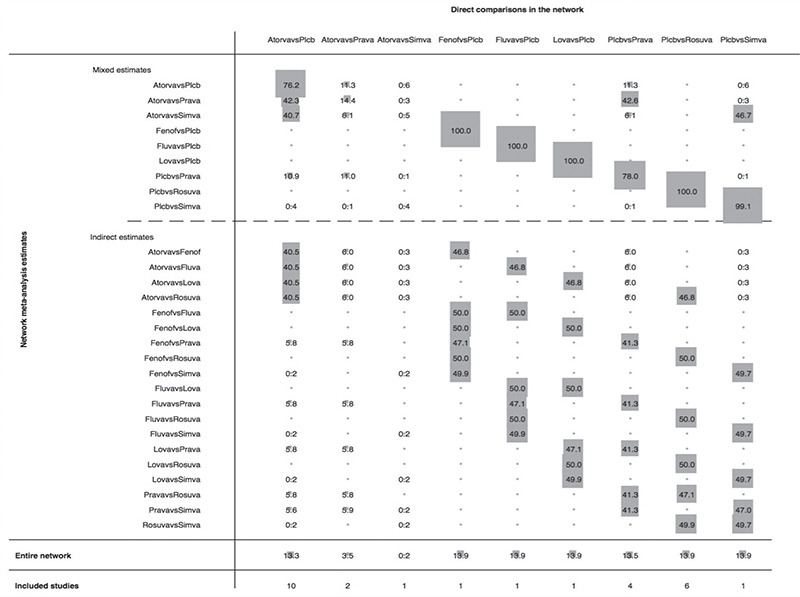
Contribution plot of each direct comparison in the network. The figure depicts the percentage contribution of each direct comparison to the network summary estimates in the entire network.
Official websites use .gov
A
.gov website belongs to an official
government organization in the United States.
Secure .gov websites use HTTPS
A lock (
) or https:// means you've safely
connected to the .gov website. Share sensitive
information only on official, secure websites.
Contribution plot of each direct comparison in the network. The figure depicts the percentage contribution of each direct comparison to the network summary estimates in the entire network.