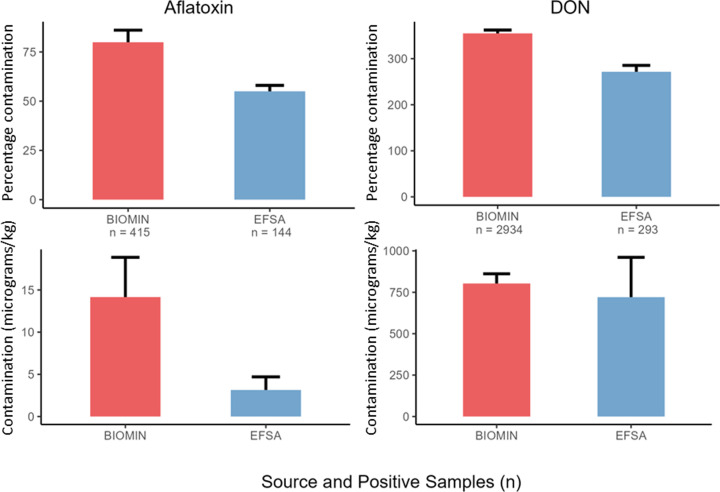
Figure 4. Mycotoxin contamination of animal feed maize exceeds contamination for food maize.
Bar plots depicting the percentage and number (n) of samples containing aflatoxin and DON and the mean concentration (µg mycotoxin per kg of grain) of each mycotoxin. Contamination data for European feed maize from 2016 to 2022 were taken from BIOMIN GmbH annual mycotoxin reports and EFSA mycotoxin surveillance data were used for food cereals. Two outliers with excessively high contamination (790 µg/kg aflatoxin, 23500 µg/kg DON) were omitted from analysis. Error bars represent standard deviation around the mean.

