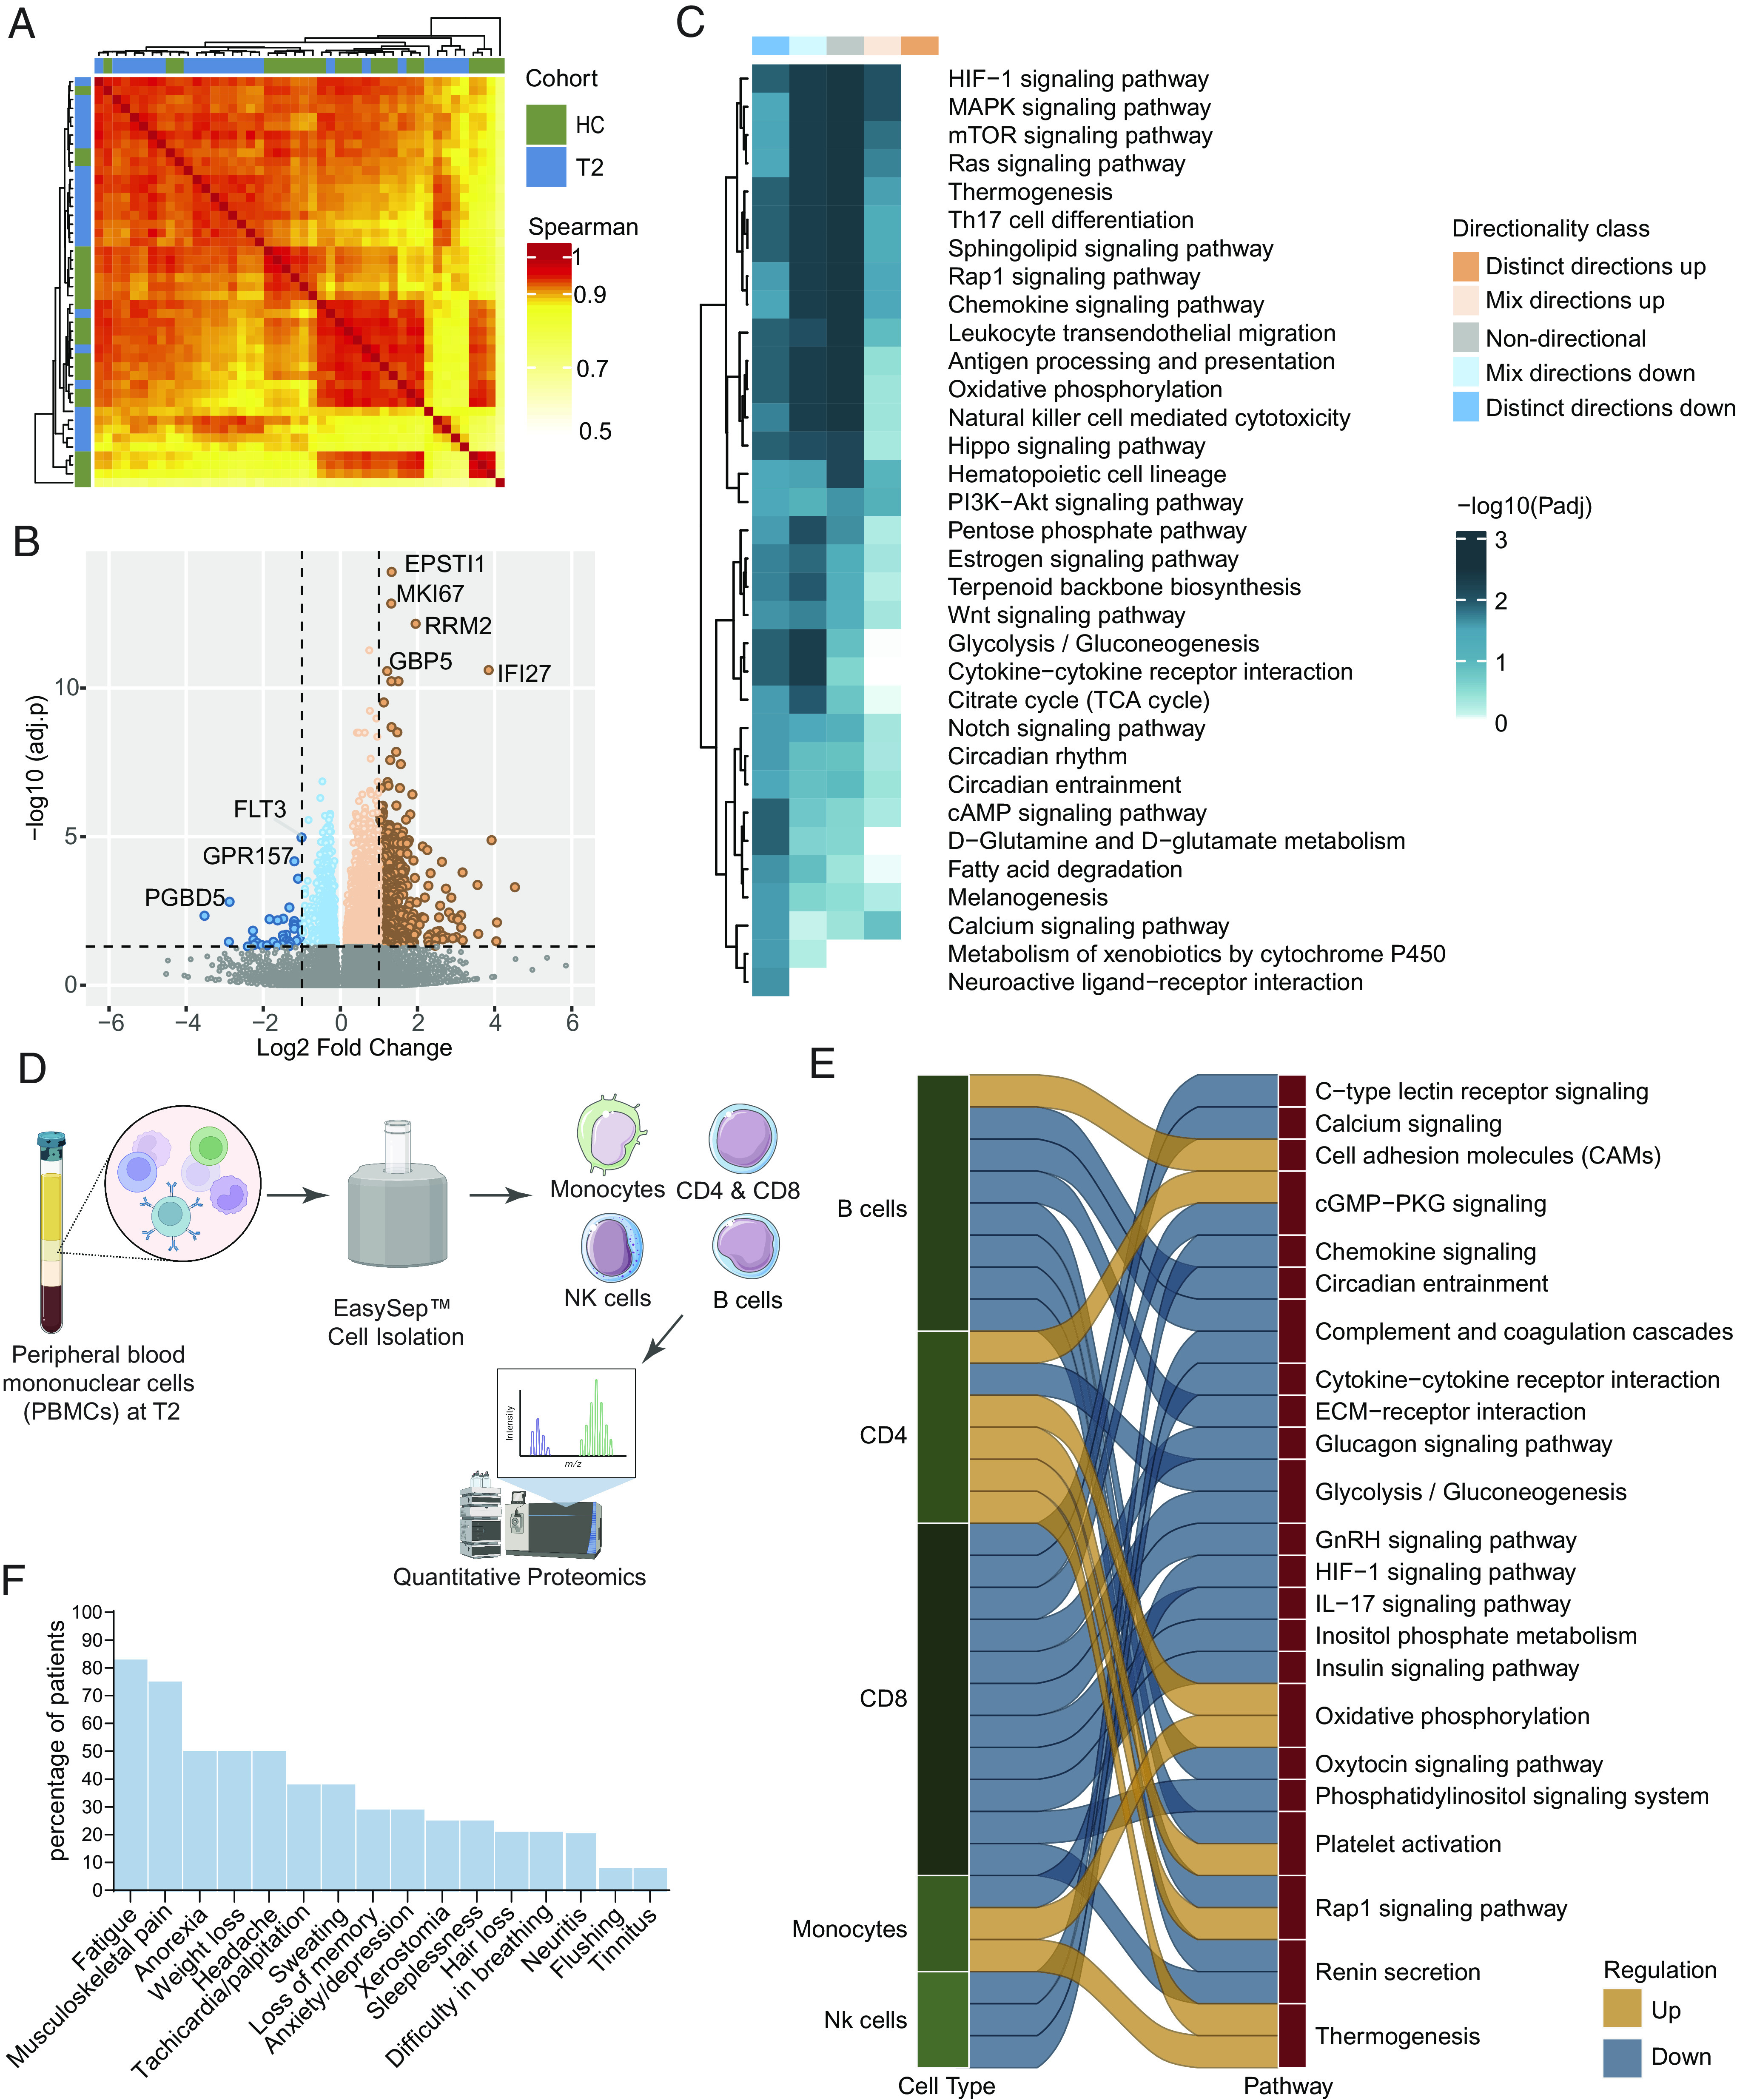
Fig. 5.

Postrecovery immune signature compared to the CCHFV-seronegative samples (A) Patient-to-patient correlation between patient samples using Spearman's correlation metric HC (n = 22) and T2 (n = 24). The heatmap shows correlation coefficients computed using scaled TPM values of the top 5,000 varying genes based on the median absolute deviation. All correlations were highly significant (adjusted P < 0.0001) due to the high number of features used. Column and row annotations represent patient cohorts. (B) Volcano plot of DGE analysis between cohorts. Negative log2 fold change values represent downregulation, and positive values represent upregulation at T2 compared to HC. The top significantly expressed genes are labeled. (C) Significantly enriched pathways at T2 compared to HC (adjusted P < 0.05). The heatmap shows negative log scales adjusted P-values of different classes of directionality. Distinct directional classes of P-values calculated from gene statistics and expression direction were used to define up-regulated and down-regulated pathways. (D) Experimental design of isolation of immune cells. Figure created with Biorender.com (E) Significantly up-regulated and down-regulated (adjusted P < 0.2) pathways in CCHFV convalescent patients compared to HC in each cell type computed from sctProteomics data analysis. (F) Proportion of the symptoms of the PVF syndrome in CCHFV-recovered patients.
