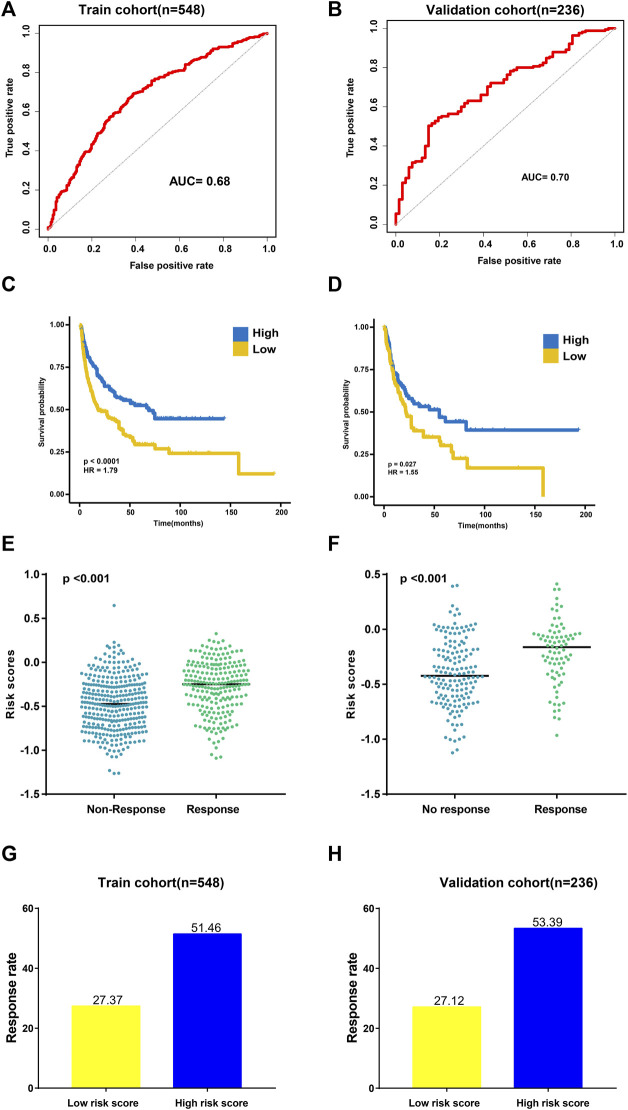
FIGURE 2.
Validation of the TAE risk score model. (A,B) Sensitivity and specificity of the TAE score model were assessed in each dataset by time-dependent ROCR analysis. (C,D) Kaplan–Meier curves for overall survival. Overall survival by the risk score in the training (C) and validation cohorts (D) (E,F) Distribution of the TAE score among samples grouped by their response to immunotherapy in the training (E) and validation cohorts (F) (G,H). Response rate to immunotherapy in low- and high score groups stratified by TAE score in the training (G) and validation cohorts (H).

