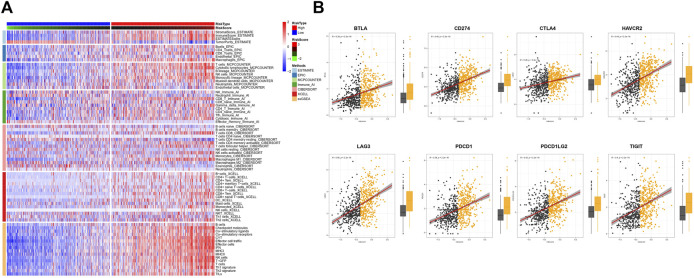
FIGURE 3.
Tumor immunity analysis of the TAE score model. (A) Heatmap for immune responses based on ESTIMATE, EPIC, MCPcounter, Immune AI, CIBERSORT, xCell, and ssGSEA algorithms among high- and low-risk score groups. (B) Association between checkpoint molecules BTLA, CD274, CTLA4, HAVCR2, LAG3, PDCD1, PDCD1LG2, and BTLA, and TAE scores and their distribution in the low- and high score groups.

