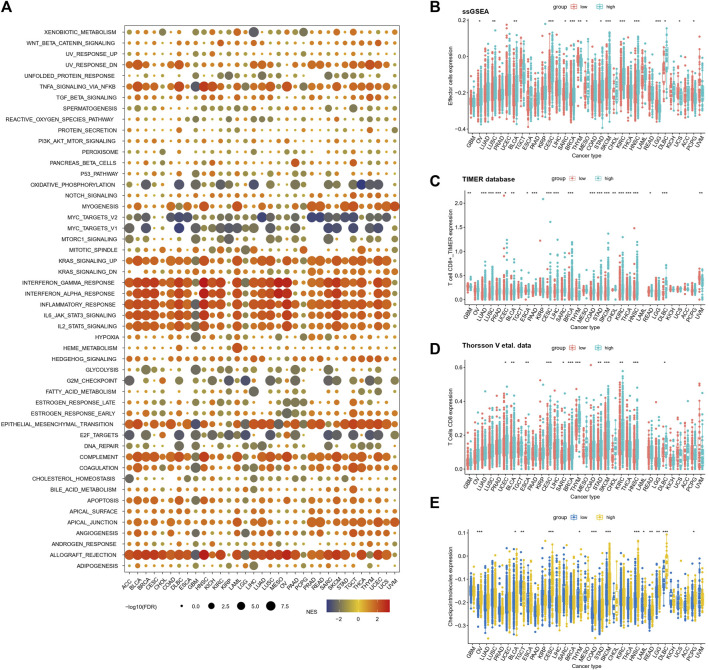
FIGURE 5.
Relationships between inflammatory response risk scores and signaling pathways and immunophenotypes (A) Relationships between TAE risk scores and signaling pathways in cancer patients with high- and low-risk scores. Normalized enrichment scores and p-values were determined using the GSEA algorithm. (B–D) Infiltration levels of effector cells in the low- and high score groups were stratified by TAE risk scores in 33 cancer types from TCGA using ssGSEA analysis (D,E), TIMER database (C), and Thorsson et al.'s data (D) (E) Checkpoint molecule scores in low- and high-risk score groups stratified by the TAE scores in 33 cancer types.

