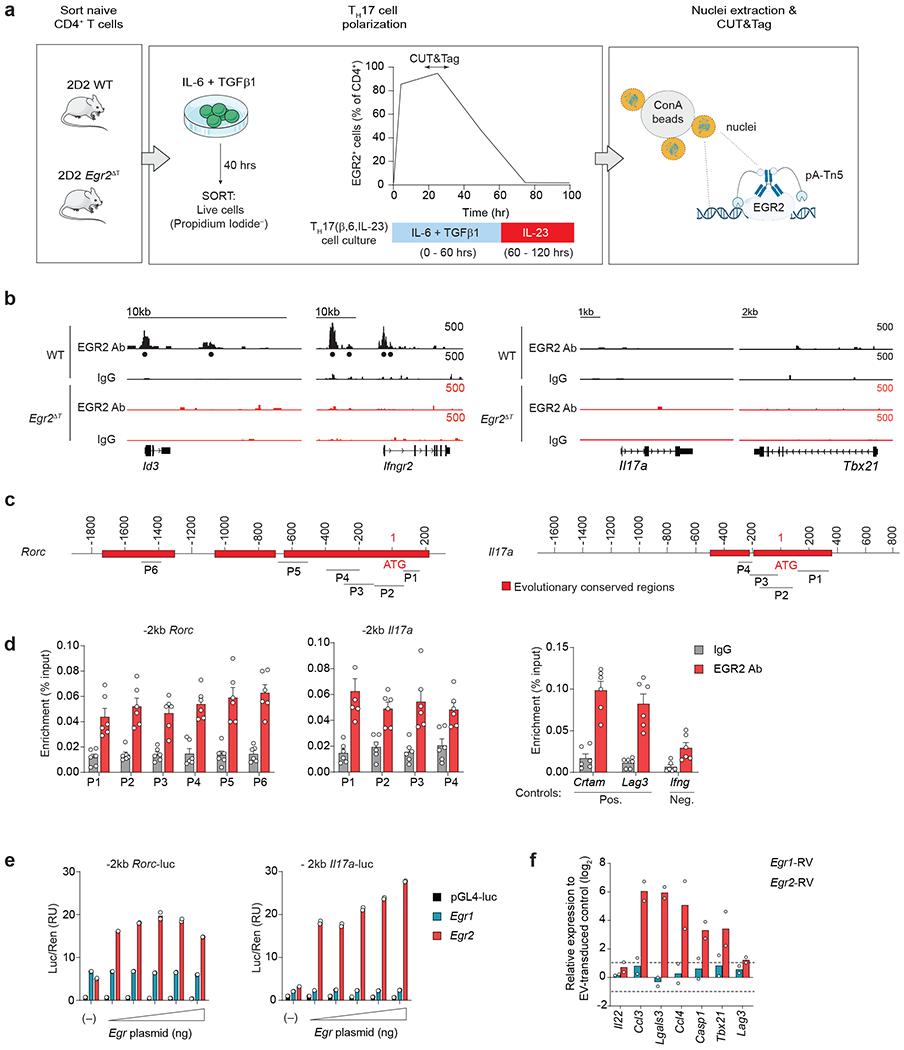
Extended Data Fig. 5. EGR2 binds to and transactivates Rorc and Il17a promoters.

a, CUT&Tag Workflow. CUT&Tag sequencing was performed on nuclei isolated from live (propidium iodide− sorted) 2D2 WT and 2D2 Egr2ΔT TH17(β,6) cells at the peak of EGR2 expression (40h post-activation) using EGR2 antibody or IgG control. b, (Left) Genome browser tracks at Id3 and Ifngr2, showing EGR2 binding in 2D2 WT TH17(β,6) cells. (Right) Genome browser tracks at Il17a and Tbx21 showing no EGR2 binding in 2D2 WT TH17(β,6) cells. c, Evolutionary conserved regions (ECRs) and EGR binding sites within each ECR of Rorc and Il17a genes were analyzed using ECR browser (https://ecrbrowser.dcode.org/) and JASPAR (http://jaspar.genereg.net/). ChIP primers (P) to determine EGR2 binding to predicted EGR binding sites were designed using Primer3 (http://bioinfo.ut.ee/primer3-0.4.0/). d, EGR2 ChIP-PCR analysis of 2D2 TH17(β,6) cells 48h after activation with plate-bound CD3+CD28 antibodies, showing EGR2-specific binding to Rorc and Il17a promoters. Crtam intron and Lag3 core promoters were used as positive controls. Ifng promoter and IgG control antibody were used as negative controls. Results are presented as percent of input DNA. Data are shown as mean ± s.e.m. and represent biologically independent replicates from n = 3 independent experiments. e, Firefly luciferase activity (normalized to Renilla) driven by the 2kb genomic DNA sequences upstream of the start codon (ATG) of Rorc and Il17a was measured in the presence of increasing doses of Egr1- or Egr2-expressing plasmids in HEK293 cells. Data represent technical duplicates and are representative of n = 3 independent experiments. f, Quantitative RT-PCR analysis of ‘pathogenicity-associated’ genes in TH17(β,6) cells transduced with Egr1-RV or Egr2-RV and normalized to empty virus (EV-RV)-transduced control TH17(β,6) cells. RT-PCR analysis was performed on RNA isolated from sorted retrovirally-transduced cells. Data represent biologically independent replicates per condition from n = 2 independent experiments.
