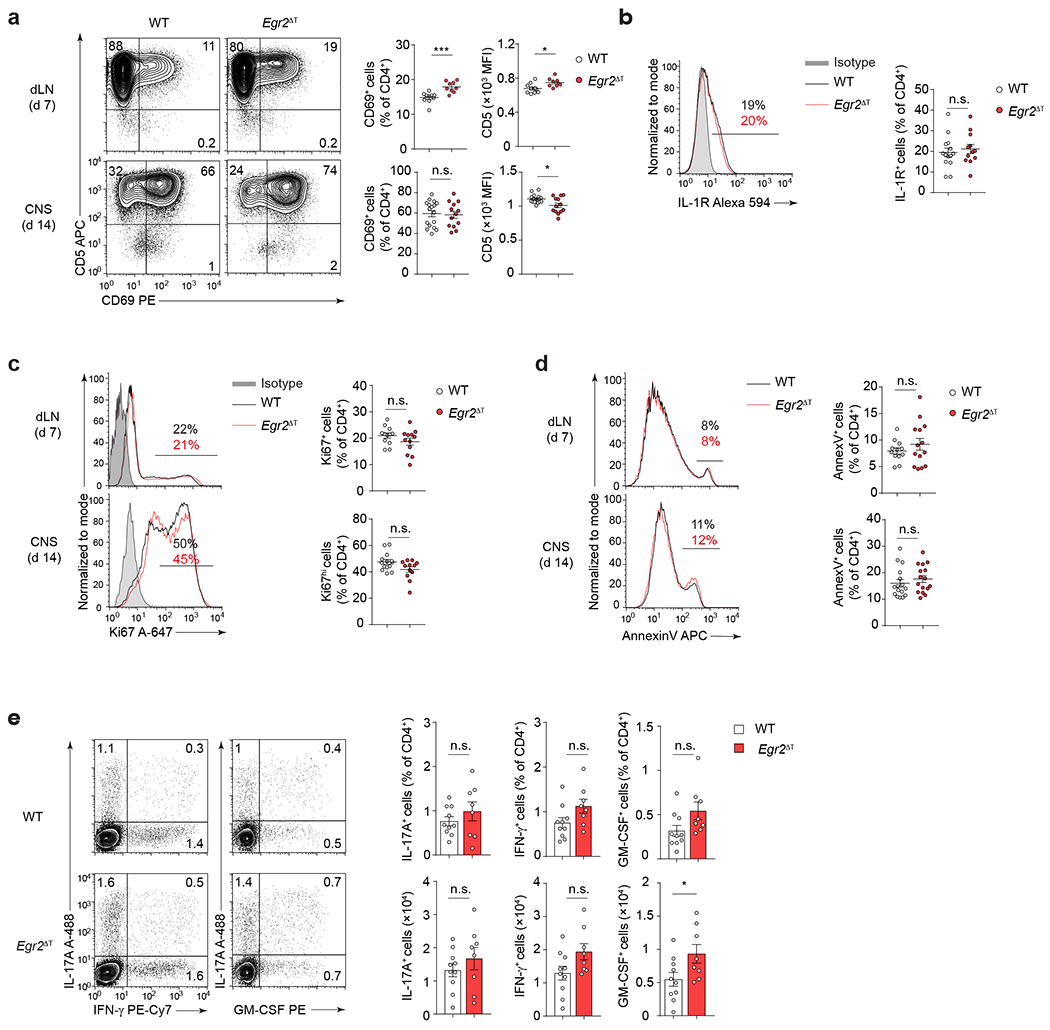
Extended Data Fig. 6. EGR2 is not required for CD4+ T cell activation.

a, CD5 and CD69 protein expression (MFI, frequency) in CD4+ T cells isolated from draining lymph nodes (dLN) and CNS of WT (n = 17) and Egr2ΔT (n = 13) mice following immunization with MOG35-55/CFA and Pertussis toxin. ***P < 0.001, *P < 0.05, n.s. = not significant, two-tailed Mann-Whitney U test. b, IL-1R expression in CNS-infiltrating CD4+ T cells from WT (n = 14) and Egr2ΔT (n = 12) mice 14 days post-immunization as in a. n.s. = not significant, two-tailed Student’s t-test. c-d, Expression of Ki67 marker of proliferation (c) and Annexin V marker of apoptosis (d) in CD4+ T cells isolated from draining lymph nodes and CNS of WT (n = 14, Ki67; n = 16, AnnexinV) and Egr2ΔT (n = 12, Ki67; n = 16, AnnexinV) mice post-immunization as in a. n.s. = not significant, two-tailed Student’s t-test. e, Contour plots depict representative intracellular cytokine staining for IL-17A, IFN-γ and GM-CSF and bar graphs summarize the frequency and the absolute numbers of IL-17A-, IFN-γ- and GM-CSF-producing CD4+ T cells in the draining lymph nodes of WT (n = 10) and Egr2ΔT (n = 8) mice 7 days post-immunization as in a; Data are represented as mean± s.e.m. and are combined from 3 (a-d) and 2 (e) independent experiments.
