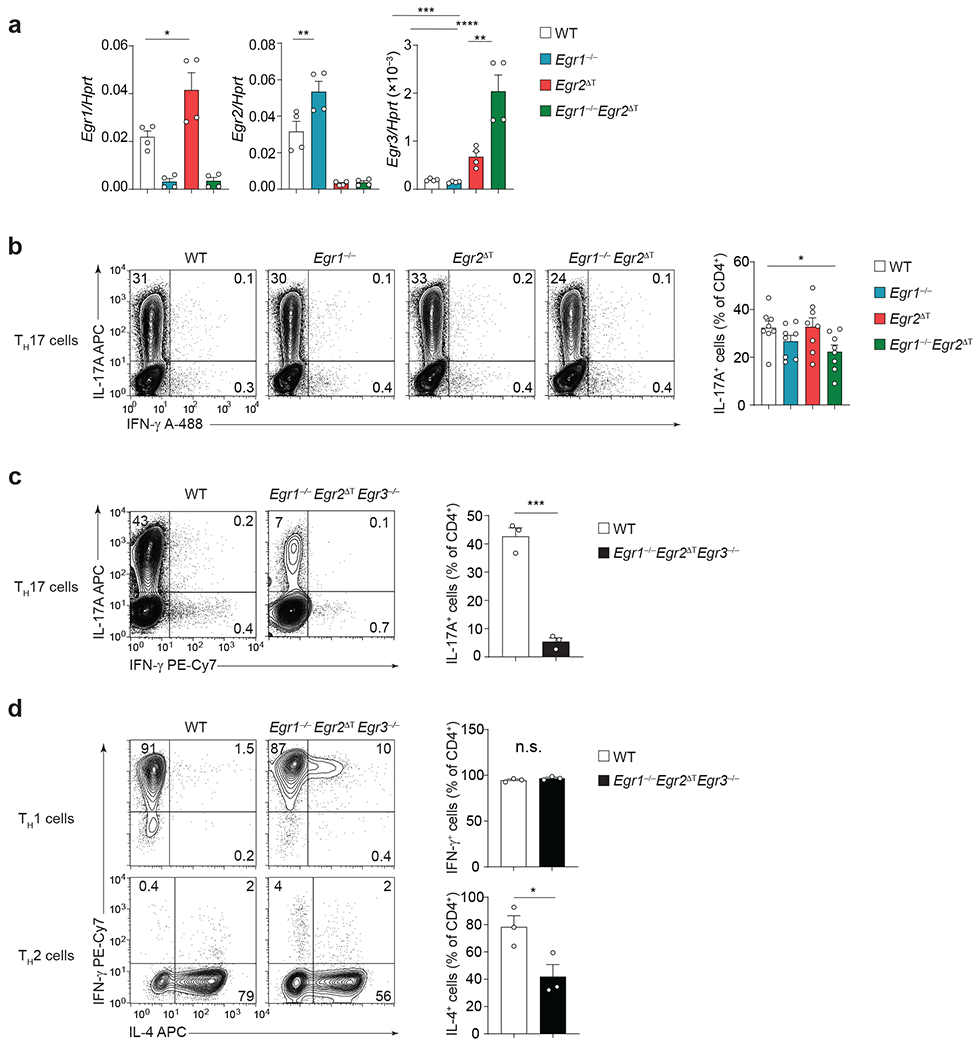
Fig. 2 |. EGR2 is not required for TH17 lineage commitment.

a, Quantitative RT-PCR analysis of Egr1, Egr2 and Egr3 mRNA expression in wild-type (WT), Egr1−/−, Egr2ΔT and Egr1−/−Egr2ΔT CD4+ T cells cultured with IL-6+TGF-β1 (TH17 cell-polarizing conditions) for 5 days, following ex vivo 4h stimulation with PMA+Iono; n = 4 from 2 independent experiments. *P < 0.05, **P = 0.0011, ***P = 0.0001, ****P < 0.0001; One-way ANOVA, followed by two-tailed unpaired Student’s t-test. b, IL-17A and IFN-γ production by WT, Egr1−/−, Egr2ΔT and Egr1−/−Egr2ΔT CD4+ T cells cultured with IL-6+TGF-β1 as in a was measured by flow cytometry following 4h stimulation with PMA+Iono. n = 7 independent experiments. *P < 0.05; One-way ANOVA, followed by two-tailed unpaired Student’s t-test. c-d, Frequency of cytokine-producing WT and Egr1−/−Egr2ΔTEgr3−/− CD4+ T cells cultured with IL-6+TGF-β1 as in a (c) and TH1- (IL-2+IL-12) or TH2 (IL-2+IL-4) polarizing conditions (d) following ex vivo 4h stimulation with PMA+Iono. n = 3 independent experiments. ***P < 0.001, n.s. = not significant; One-way ANOVA, followed by two-tailed unpaired Student’s t-test. Data are presented as mean ± s.e.m. in a-d.
