
Fig. 3 |. EGR2-specific transcriptional regulatory network in TH17 cells.
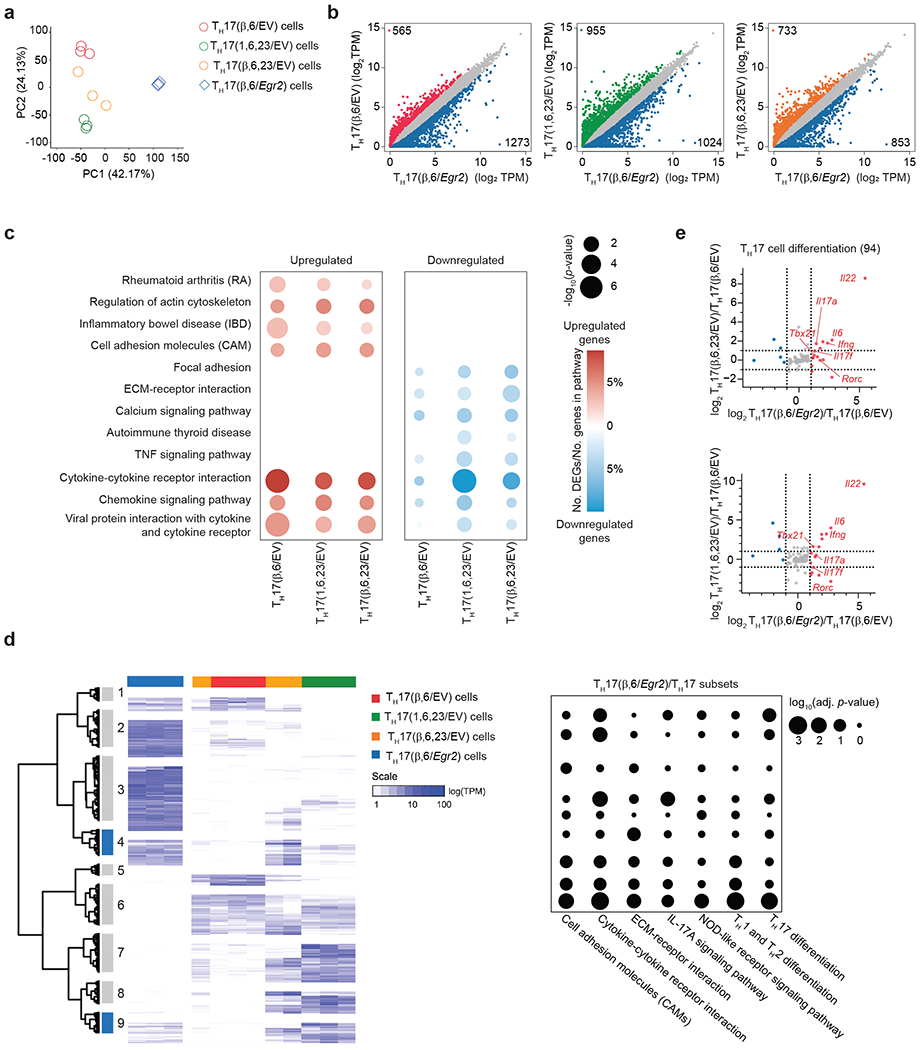
a, Scatter plot showing principal component analysis (PCA) of complete transcriptomes of TH17(β,6/EV), TH17(β,6/Egr2), TH17(β,6,23/EV) and TH17(1,6,23/EV) subsets. b, Scatter plot of differentially-expressed genes (DEGs) between TH17(β,6/Egr2) versus TH17(β,6/EV), TH17(β,6,23/EV) and TH17(1,6,23/EV) subsets. c, Dot-plot of selected Gene Ontology (GO) pathways that were up-regulated or down-regulated in TH17(β,6/Egr2) versus non-pathogenic TH17(β,6/EV) or pathogenic TH17(β,6,23/EV) and TH17(1,6,23/EV) subsets. Color indicates the percentage of DEGs in the selected GO pathways and the size indicates the −log10(p-value). d, Hierarchical clustering of DEGs in TH17(β,6/Egr2), non-pathogenic TH17(β,6/EV) or pathogenic TH17(β,6,23/EV) and TH17(1,6,23/EV) subsets. Clusters marked in blue contain genes induced in TH17(β,6/Egr2) cells and are highly expressed in TH17(β,6,23/EV) and TH17(1,6,23/EV) subsets, but not TH17(β,6) cells. Heat map shows log10-normalized transcript per million (TPM) expression level. Dot-plot shows adjusted p-value for selected KEGG pathway enrichments across all gene clusters. e, Ratio-ratio plots of log2 fold-change between TH17(β,6/Egr2) and TH17(β,6/EV) cells on x-axis versus fold-change between TH17(β,6,23/EV) (top) or TH17(1,6,23/EV) (bottom) and TH17(β,6/EV) on y-axis for all genes from the KEGG TH17 differentiation pathway (mmu04659). a-e Data represent biologically independent replicates per condition from n = 3 independent experiments.