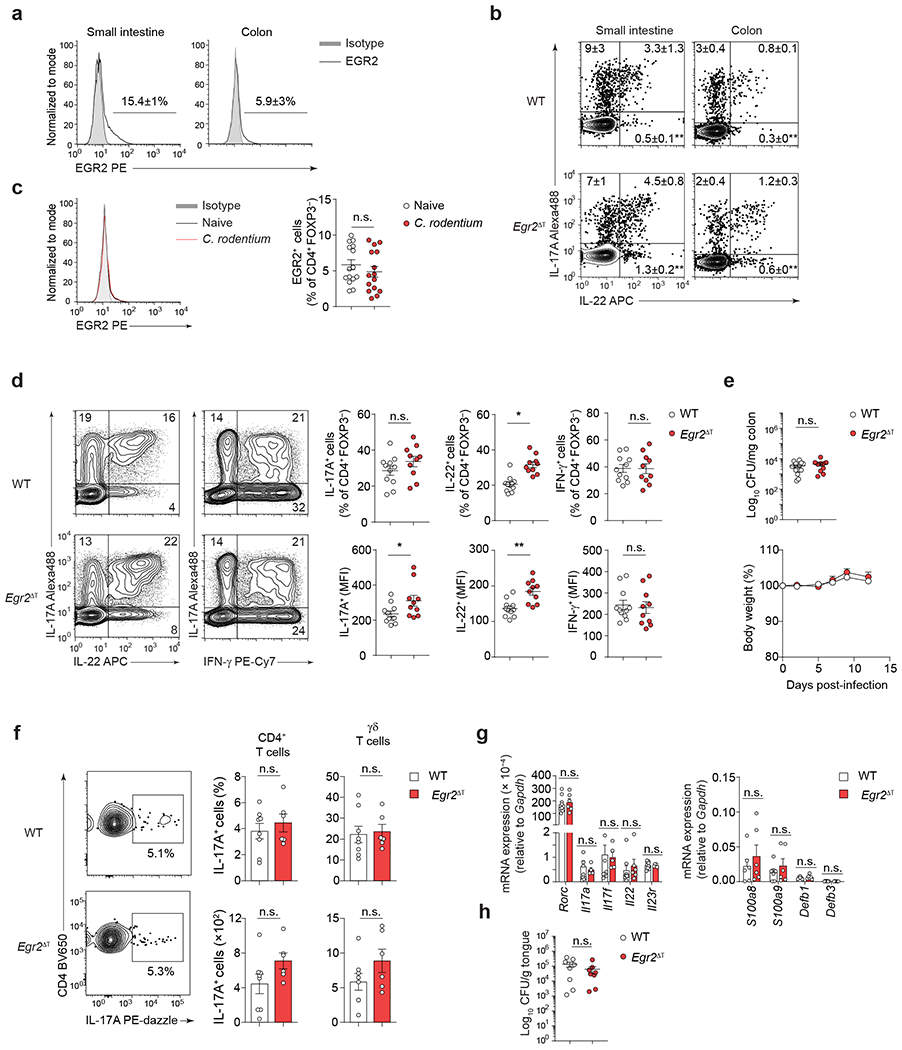
Fig. 4 |. EGR2 is not essential for homeostatic TH17 cells.

a, Percentage of EGR2-expressing CD4+FOXP3− T cells in the small intestine (n = 5) and colon (n = 15) of SFB-colonized mice at steady-state; 3 independent experiments. b, Percentage of IL-17A- and IL-22-producing CD4+FOXP3− T cells in the small intestine and colon of SFB-colonized WT (n = 5, small intestine; n = 8, colon) and Egr2ΔT (n = 5, small intestine; n = 7, colon) mice was determined by flow cytometry following ex vivo PMA+Iono stimulation; 2 (small intestine) and 3 (colon) independent experiments. **P < 0.01; two-tailed Student’s t-test. c, Percentage of EGR2-expressing CD4+FOXP3− T cells in the colon of naïve (n = 15) and Citrobacter rodentium-infected (n = 15) mice (12 days p.i.); 3 independent experiments. n.s. = not significant; two-tailed Student’s t-test. d, Frequency and MFI of IL-17A, IL-22 and IFN-γ production by colonic CD4+FOXP3− T cells from C.rodentium-infected WT (n = 11) and Egr2ΔT (n = 10) mice (day 12 p.i.) was determined by flow cytometry following ex vivo PMA+Iono stimulation; 3 independent experiments. **P < 0.01, *P < 0.05, n.s. = not significant; two-tailed Student’s t-test. e, Bacterial burden in the colon (12 days p.i.) and body weight (2, 5, 7, 9, 12 days p.i.) of Citrobacter rodentium-infected WT (n = 15) and Egr2ΔT (n = 10) mice, calculated as the percent difference between the original body weight (day 0) and the body weight on any given day; 3 independent experiments. n.s., not significant; two-tailed Student’s t-test. f, Frequency and absolute number of IL-17A-producing CD4+ T cells and γδ T cells in the gingiva of Candida albicans-infected WT (n = 8) and Egr2ΔT (n = 6) mice; 2 independent experiments. n.s., not significant; two-tailed Student’s t-test. g, Quantitative RT-PCR analysis of TH17 cell signature genes and IL-17-dependent antimicrobial peptide-encoding genes from tongue homogenates of WT (n = 9) and Egr2ΔT (n = 6) mice infected with Candida albicans; 2 independent experiments. n.s., not significant; Mann-Whitney U test. h, Candida albicans colony forming units (CFU) per gram of tongue tissue at day 5 post-infection; WT (n = 8) and Egr2ΔT (n = 6) mice; 2 independent experiments. n.s., not significant; two-tailed Student’s t-test. Data are presented as mean ± s.e.m. in a-h.
