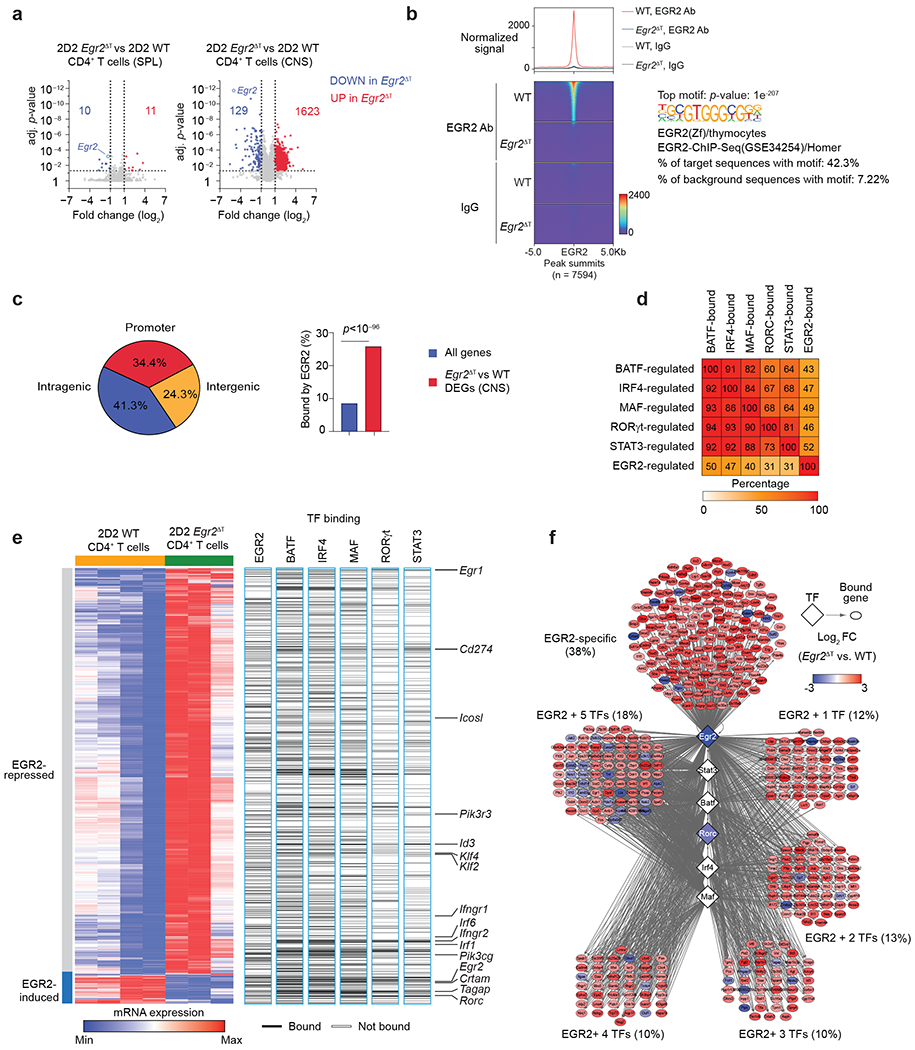
Fig. 6 |. EGR2 drives regulatory network in pathogenic TH17 cells.

a, Volcano plots showing log2 fold-change on x-axis and adjusted p-value on y-axis for all measured transcripts. Red and blue points denote genes that were significantly up- or down-regulated in 2D2 Egr2ΔT CD4+ T cells compared to 2D2 WT CD4+ T cells from the spleen and CNS of T-cell-deficient (Tcrb−/−) mice that received either 2D2 WT or 2D2 Egr2ΔT TH17(β,6,23) cells (20 days post-transfer). Dotted lines indicate fold-change and p-value thresholds for DEGs. Data represent biologically independent replicates from n = 3 independent experiments. b, Histogram (top) and heatmap (bottom) of EGR2 signals, centered on peaks in 2D2 WT versus 2D2 Egr2ΔT TH17 (β,6) cells 40h post-activation with plate-bound CD3+CD28 antibodies (GSE226795). Both EGR2 antibody (top) and IgG controls (below) are shown. Right, the enrichment of the top motif underlying peaks in EGR2 Ab-fraction of 2D2 WT TH17 cells. c, Pie chart showing the distribution of EGR2-bound loci across the genome (promoter, intragenic, intergenic) (left) and bar graph of the proportion of DEGs bound by EGR2 versus all genes across the genome (right). d, Heatmap showing the percentage of BAT-, IRF4-, MAF-, RORγt-, STAT3 and EGR2-regulated genes that are also co-bound by each transcription factor. e, Heatmap showing DEGs between 2D2 WT and 2D2 Egr2ΔT CD4+ T cells from the CNS of Tcrb−/− mice that received either 2D2 WT or 2D2 Egr2ΔT TH17(β,6,23) cells (20 days post-transfer) as in a, and the binding of EGR2, BATF, IRF4, MAF, RORγt, and STAT317. f, Network diagram depicting EGR2-dependent genes bound by EGR2 alone or by EGR2 in combination with 1, 2, 3, 4, or all 5 core TH17-lineage specific transcription factors.
