
Figure 3.
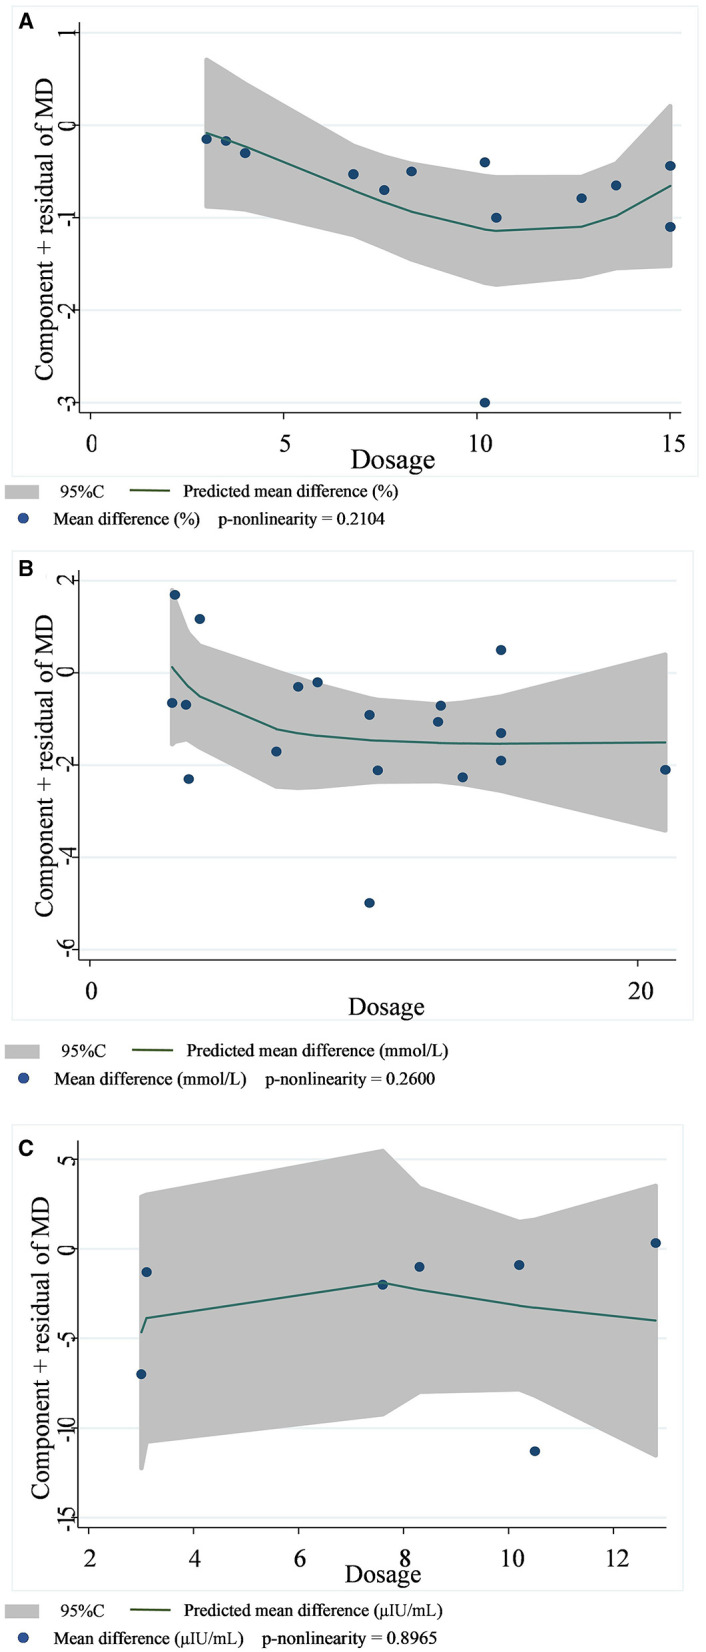
Non-linear dose–response relationships between viscous soluble dietary fiber (g) and the nonstandard mean difference (g/day) in HbA1c (A), FBG (B), and fasting insulin (C). 95%CI is displayed in shaded areas. HbA1c, glycosylated hemoglobin; FBG, fasting blood glucose.