
Figure 7.
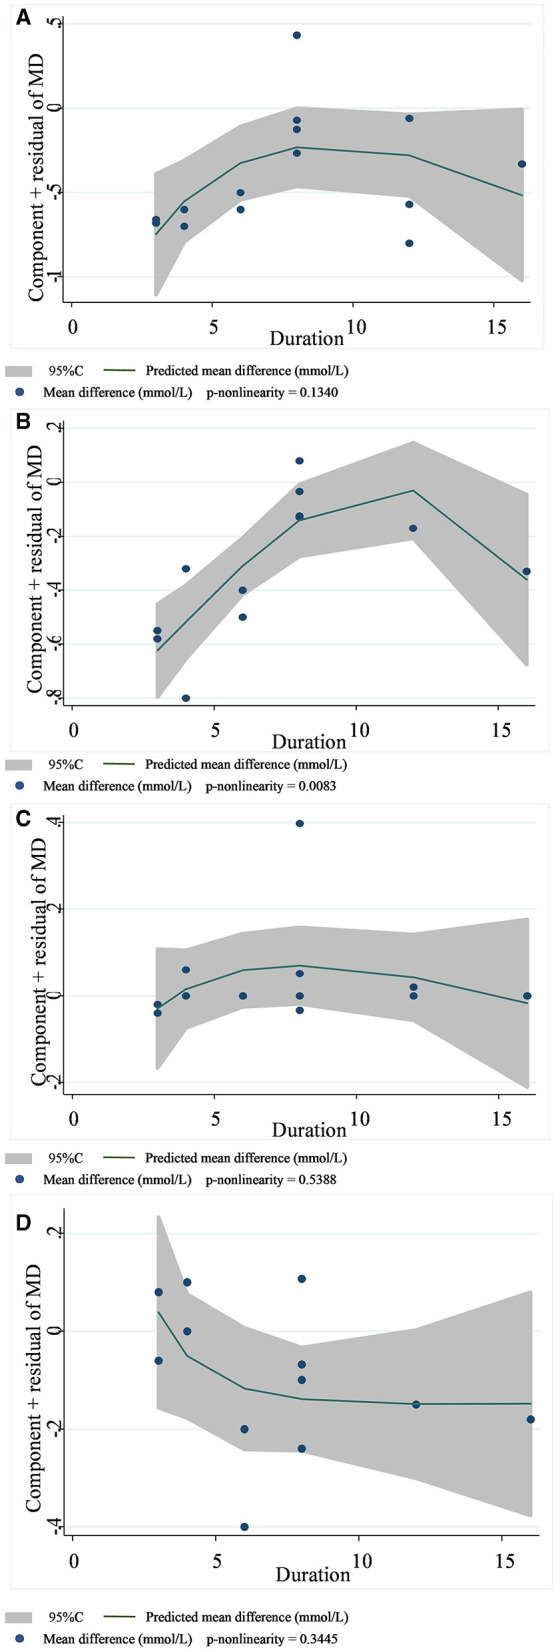
Non-linear dose–response relationships between supplementation duration (weeks) and the nonstandard mean difference (g/day) in TC (A), LDL-C (B), HDL-C (C), and TG (D). 95%CI is displayed in shaded areas. TC, total cholesterol; LDL-C, low-density lipoprotein cholesterol; HDL-C, high-density lipoprotein cholesterol; TG, triglyceride.