

Abstract

A gas sensor is a device that detects the presence of gases in a specific area. This research work demonstrates the effectiveness of gas sensors based on graphene oxide (GO) and copper oxide (CuO) semiconductor nanomaterials for the detection of carbon dioxide. GO and CuO were prepared by the modified Hummer’s method and precipitation method using CuCl2 as a precursor, respectively. These materials are made into a hybrid using poly(vinyl alcohol) (PVA)/poly(vinylpyrrolidone) (PVP) polymer solutions of low concentrations and are spin coated onto the pattern-etched copper-clad substrate. The sensor is tested using a source measurement unit (SMU) to obtain the change in the resistance of the sensor in open air and in a carbon dioxide environment. The fabricated sensor with an Arduino microcontroller detection unit showed a good sensing response of 60%.
1. Introduction
Sensors are a basic component in nature that can be seen anywhere in and around us. There are a number of natural sensors in nature which are made up of molecules or cells and can particularly detect the measures toward which they are sensitive. Specialized cells sensitive to light, motion, temperature, magnetic fields, gravity, humidity, moisture, vibration, pressure, electrical fields, sound, biomolecules, toxins, etc., are present in nature.1,2 A sensor is a device, unit, or system which is designed to analyze the changes or processes happening in and around its components and direct the detected data to other devices such as electronic devices or computers.3
Zaaba et al.4 demonstrated graphene oxide synthesis by the modified Hummer’s method. Robinson et al.5 experimented on graphene oxide as an active material for high-performance molecular sensors. Naik and Krishnaswamy6 demonstrated a room-temperature humidity sensing device using graphene oxide (GO) thin films produced by chemical exfoliation. Papamatthaiou et al.7 experimented on GO, a functionalized form of graphene, which has enhanced sensing properties as its defects further enhanced the chemical interaction with the gas molecules. Graphene-based hybrids were demonstrated by Meng et al.,8 as chemi-resistive gas sensors with high sensitivity and selectivity. Li et al.9 have investigated the GO for humidity sensing. Taylor and Velásquez-García10 reported their study on nanostructured GO gas sensors. Park et al.11 have demonstrated their work on tuning of the GO synthesis process. Balashov et al.12 worked on the kinetic characteristics of the SAW humidity sensor. Bannov et al.13 experimented on graphite oxide for gas sensing.
Tanvir et al.14 have published their work regarding the low temperature effects on CO2 sensing. Kshirsagar et al.15 demonstrated the preparation of CuO nanoparticles by the inexpensive sol–gel method and studied the development in critical heat flux. Chand et al.16 synthesized CuO nanoparticles by the sol–gel method. Phiwdang et al.17 prepared CuO by the precipitation method using different precursors. Mirmotallebi et al.18 have published their work on reduced graphene oxide for hydrogen sulfide gas sensing. In this work, three-dimensional reduced graphene oxide (3D-rGO) structures decorated with CuO particles (GCu) are synthesized through an effortless and scalable method for the detection of hydrogen sulfide (H2S) gas. Basu and Bhattacharyya19 have reported a review paper on recent developments in gas sensors. In this work, graphene and graphene oxide sensors are studied in accordance with the most recent developments. Graphene-based gas and vapor sensors concerned in this experiment are graphene-based resistive gas/vapor sensors, graphene-based field effect transistor (FET) gas/vapor sensors, graphene-based surface acoustic wave (SAW) gas/vapor sensors, graphene-based quartz crystal microbalance (QCM) gas/vapor sensors, graphene-based MEMS gas sensors, and graphene-based metal oxide hybrid gas sensors. The techniques and methods employed for the above sensors are revived in a detailed manner. Wu et al.20 worked on a facile, cost-effective, and two-step strategy to design a nanoporous graphene (Gr) thin film for improved gas sensing at room temperature. Yoon et al.21 showed the preparation of graphene samples concerning the design of polydimethylsiloxane stamps by mixing PDMS and a curing agent in a 10:1 ratio and pouring the mixture into a stamp mold for curing. To analyze the performance of the designed graphene device as a CO2 sensor, they calculated its electrical transfer properties upon exposure to CO2 gas at different concentrations. Tanvir et al.22 reported their experimentation on CO2 gas sensing with metal oxide nanoparticles. Fanli Meng et al.23 created a reduced graphene oxide (rGO)/Co3O4 nanocomposite using a one-step hydrothermal process. Then, different characterization techniques were used to characterize rGO/Co3O4 nanocomposites. It was discovered that the structure of rGO nanosheets coated with cobalt tetroxide (Co3O4) nanoparticles had been effectively synthesized. Transmission electron microscopy (TEM) and SEM were used to view the interior morphology in detail. Recently, chemical sensors have undergone rapid development.23,24 Yang et al.25 described a simple method for creating a sturdy cellulose membrane device coated in PDA/TOB@CA. The PDA/TOB@CA membrane not only exhibited synergistic antibacterial behavior with long-term and sustained antibiotic release profiles, but it also attained a high-water evaporation rate. By using the template synthesis method, followed by etching and phosphating processes, Ni–Co–P hollow nanobricks (HNBs) were created by Chen et al.26 SEM, X-ray diffraction, nitrogen sorption analysis, and TEM were all used to characterize the hierarchical morphology and composition of Ni–Co–P HNBs. In a wide moisture range from 0 to 97.5% RH, high sensitivity (3.6 k/% RH), low hysteresis (3% RH), and good repeatability were attained. An eco-friendly cotton fiber-based piezoresistive textile (CF p-textile) for biomonitoring was created by Pan et al.27 MXene flakes were applied using a dip-coating technique to the porous cotton cellulose fibers, resulting in a solid bond thanks to hydrogen bonding.
In recent years, metal oxide semiconductors have been widely used as gas sensors for the detection of toxic and flammable gases.28–31 The GO/CuO nanohybrid has properties such that the sensor made out of it shows high efficiency compared to the sensors made up of individual components. The electrical properties can change drastically due to the binding of two different materials, and one can get improved efficiency and sensitivity. In this work, we demonstrate a sensor which detects CO2 with an expected higher efficiency. The GO/CuO gas sensor is fabricated using a copper-clad or printed circuit board. The resistivity of the material (considering the material thickness is 10 μm and the area of the composite film is 1 cm2) is ∼1 kΩ·cm. The content of GO in the composite is 0.005 g of GO and 0.005 g of CuO in 5 mL of polymer solution. It is seen that the GO effect is not very high for this content. The interdigitated electrode is patterned on either of these boards by chemical etching using FeCl3, and then the hybrid is spin coated over it. The sensing property can be studied by using the Keithley Source/Measure unit (SMU).32–37
2. Experimental Procedure
All of the chemicals used for this study were purchased from Meck India Pvt Ltd. The synthesized graphene oxide and copper oxide nanoparticles are characterized by UV–vis spectroscopy, scanning electron microscopy, and energy dispersive X-ray spectroscopy (EDS) analysis. The efficiency of the gas sensor is determined using a Keithley meter. The detection system consists of a homemade gas chamber with a CO2 gas inlet, and the sensor is placed in the chamber and connected to the Keithley current source. Before gas detection, the measurement is taken with the air inside the chamber and then with the CO2 in the chamber. The experimental setup is shown in Figure 1. The experiments were conducted under controlled humidity conditions to evaluate the sensor’s response and stability.
Figure 1.

Experimental setup.
2.1. Preparation of Graphene Oxide
Graphene oxide (GO) was prepared from graphite powder by using the modified Hummer’s method. 2 g of graphite powder, 2 g of NaNO3, and 50 mL of H2SO4 (98%) were mixed in a 500 mL beaker kept in an ice bath (0–6 °C) with continuous stirring. The sample mixture was stirred for 2 h by maintaining same temperature, and 6 g of potassium permanganate (KMnO4) was added to the suspension very slowly. The addition rate was controlled carefully to preserve a reaction temperature lower than 10 °C. Then the ice bath was removed, and the sample mixture was stirred at 30 °C until it became pasty brownish and kept under continuous stirring for 2 h. Temperature was raised slowly up to 80 °C. Then the mixture was weakened with the slow addition of 100 mL of water. The reaction temperature was increased quickly to 96 °C with effervescence, and the color changed to a brownish color. Furthermore, this solution mixture was weakened by the addition of 200 mL of water under continuous stirring. The solution mixture was finally treated with 8 mL of H2O2 to terminate the reaction by the formation of a yellowish brown color. For purification, the mixture was washed by centrifugation and rinsing with 5% HCl and then distilled water several times. After filtration and drying in a microwave oven, graphene oxide (GO) was obtained in the powder form.
2.2. Synthesis of Copper Oxide Nanoparticles
0.1 M copper(II) chloride solution is prepared by dissolving 4.3 g of CuCl2 in 100 mL of distilled water and stirring well until it is dissolved completely. A 0.2 M NaOH solution is prepared in 100 mL of distilled water. 50 mL of 0.1 M CuCl2 solution is taken in a beaker, and NaOH solution is added dropwise under continuous stirring until the color of the mixture changes to brown color. The mixture is then continuously stirred for 30 min, which results in precipitation. The precipitate is centrifuged and washed several times with distilled water. The particles were obtained by filtration and calcination at 100 °C for 30 min.
2.3. Sensor Fabrication
The schematic representation of the GO/CuO gas sensor is given in Figure 2.
Figure 2.

Sensor fabrication process.
2.3.1. Patterning the Copper-Clad Substrate
The patterning of the copper-clad substrate is done with a permanent black ink marker. This marker ink prevents the etching of copper whereever it is required. At first, the copper clad, which is cut into the required dimensions, is washed thoroughly with clean water or acetone. Then, the required pattern of electrodes is drawn on the clad, and the ink is allowed to dry properly. Before etching, it is necessary to ensure that there are no unmarked areas on the patterned region. The copper is etched with the help of a ferric chloride solution. An excess amount of ferric chloride is added into the water and stirred well for complete dissolution. Precautions are taken while working with the ferric chloride solution.
The pattern-marked copper-clad substrate is then dipped in the ferric chloride solution for 10–15 min until the unmarked copper dissolves completely in the solution. Then, the substrate is taken out of the solution and washed with water. The marker ink is then dissolved and removed completely using acetone or ink remover. Finally, it is checked for any over etching and unremoved copper to make sure the etching is done properly.
2.3.2. Preparation of the GO/CuO Nanohybrid Coating Solution
To coat the etched substrate with the GO/CuO nanohybrid, we prepared the nanohybrid solution by considering a ratio for mixing the two materials. To get a uniform, sticky, and nonpeeling film on the substrate, nanomaterials are dispersed in a polymer solution of PVA/PVP mixture, containing 80% PVA and 20% PVP. Before making the polymer ratio, both polymer solutions are prepared separately, where both are 10% solution. This proportion is considered because of the high conductivity of the solution. Then, 0.005 g of both GO and CuO is dissolved in 5 mL of polymer solution, and it is spin coated on the substrate.
2.3.3. Coating of the GO/CuO Nanohybrid on the Patterned Substrate
The solution is dropped on the substrate in dynamic spinning mode at 100 rpm for 100 s and then spun at 2500 rpm for about 300 s. The film is left to dry completely for a few minutes. The coated film is about 10 micro meters. Finally, the electrodes are soldered with copper wires as contacts.
3. Results and Discussion
3.1. UV–Vis Spectrophotometry of Graphene Oxide
The synthesized and dried GO powder is dispersed in distilled water using an ultrasonicator. The ultrasonication results in dispersion GO that consists of several individual layers. The UV absorption spectra of GO depend on some of the factors, such as the number of graphene layers in dispersed GO layers and the amount of defects and impurities present in them. The UV–vis spectrophotometry provides the maximum wavelength (λmax) at which the absorption and transmission are high or low. It provides two peaks for both the UV and visible regions. The peaks depending on the GO synthesized by using the modified Hummers method showed maximum wavelengths for adsorption between 200 and 400 nm. The UV curve consists of two main peaks: one is for the π–π* transition and another is for the π*–n transition. Usually, π–π* transitions can be observed below 300 nm and π*–n transitions above 300 nm for almost all organic and inorganic materials.26
The λmax for the π–π* transition of GO is obtained at 233.6 nm (Figure 3) for an absorption value of 1.132 (au). In the π*–n transition region, it shows two peaks with absorption of 0.791 and 0.782 (au) at wavelengths 399.2 and 353.6 nm, respectively. These multiple peaks in the absorbance graph are due to vibronic coupling or electron transitions to higher excited states. This shows that the synthesized GO has good electronic properties with molecular vibrational states.
Figure 3.

UV–vis absorption peak for GO.
3.2. UV–Vis Spectroscopy of Copper Oxide (CuO) Nanoparticles
The metal oxide nanoparticles show a wide range of UV–vis spectrum. Copper oxide nanoparticles are dispersed in distilled water with ultrasonication for a long time for uniform dispersion due to the insolubility of CuO nanoparticles in water.
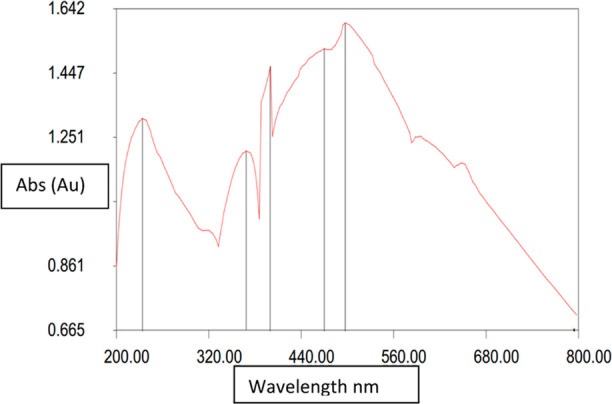
The UV spectrophotometer graph of CuO nanoparticles (Figure 4) shows the λmax for π–π* electron transitions at 233.6 nm for the absorption of 1.309 (au). Whereas, for the π*–n transitions, four high energy peaks are obtained at 497.6, 468.8, 399.2, and 368.0 nm for absorption of 1.598, 1.521, 1.468, and 1.210 (au), respectively. These multiple peaks are the results of multiple higher electronic excitations from the ground state to the excited state. The UV–vis spectroscopic results for the CuO nanoparticles show that the nano particles exhibit higher electronic transitions and can be semiconducting or conducting in nature. Its absorption is much higher in the visible region than in the UV region, which indicates that there are plenty of free electrons for conduction.
Figure 4.
UV–vis absorption peak for CuO NPs.
3.3. SEM Characterization of Graphene Oxide
The SEM images of the synthesized graphene oxide (GO) show (Figure 5) the sheets of graphene oxide which are stacked together to form GO flakes. The rough thickness range of the stacked GO is 4–8 nm. This stacking is due to the weak forces which upon dispersion by ultrasonication in water or alcohols, provide single GO sheets. The size of the synthesized CuO nanoparticles is analyzed, and the average particle diameter is found to be 350 nm. For GO stacks, which can be seen in the SEM images (they are certainly oriented in different directions) and CuO nanoparticles (star-like structure), the average thickness is calculated using the image processing software as the agglomeration does not allow us to know the exact value for the thickness.
Figure 5.

SEM images of the graphene oxide sample.
3.4. SEM Characterization of Copper Oxide Nanoparticles
The SEM image of CuO nanoparticles is shown in Figure 6. The synthesized CuO nanoparticles by the precipitation method have a flower like crystal structure. The size of the synthesized CuO nanoparticles is analyzed, and the average particle diameter is found to be 350 nm. This size of the CuO nanoparticles is due to particle agglomeration during synthesis or drying. For GO stacks, which can be seen in the SEM images (they are certainly oriented in different directions) and CuO nanoparticles (star-like structure), the average thickness is calculated using the image processing software as the agglomeration does not allow us to know the exact value for the thickness.
Figure 6.

SEM images of copper oxide nanoparticles.
3.5. EDX of Graphene Oxide
The graph (Figure 7) shows the amount of element present in the GO sample at a point in terms of the number of atoms present at that point. In the graph, it can be seen that the amount of carbon and oxygen is in a higher concentration. There are also some traces of sulfur (S) and potassium (K) in the sample as impurities, which are due to the potassium permanganate and sulfuric acid, which remained in the sample during washing.
Figure 7.

(a) EDX characterization sample image of graphene oxide. (b) EDX graph showing the number of elements present in GO sample at point 1; (c) EDX graph showing number of elements present in the GO sample at point 2; (d) EDX graph showing the number of elements present in the GO sample at point 3.
3.6. EDX of Copper Oxide Nanoparticles
The graph (Figure 8) shows the amount of element present in the CuO nanoparticles at a selected point on the SEM image, which provides the number of atoms present at that point. In the graph, the amount of copper (Cu) and oxygen (O) for different transition electrons is obtained. Copper and oxygen atoms are in higher concentrations due to the presence of some amount of carbon (C) in the sample as an impurity.
Figure 8.

(a) EDX characterization sample image of CuO NPs, (b) EDX graph showing the number of elements present in the CuO NP sample at point 1, (c) EDX graph showing the number of elements present in the GO sample at point 2, and (d) EDX graph showing the number of elements present in the GO sample at point 3.
3.7. Sensor Test Results
The sensor is tested using the SMU instrument to find the I–V characteristics and the change in resistance. The resistance of the material is calculated by varying the voltage and measuring the current with respect to it. The SMU unit directly provides the resistance value with variable current and voltage. It is found that the resistance of the nanohybrid is too high in the order of megaohms (MΩ). The resistance of the material is tested first in the open atmosphere, i.e., in air and then in a CO2 atmosphere (Figure 9). From the plot given below, we can observe that the resistance of the nanohybrid increased in the presence of CO2 rather than in air. This data aid in recognizing the presence of CO2 with the help of a sensor and changing material resistance. These values are considered as the standard resistance of the sensor and are uploaded to the Arduino system, which measures the change in resistance in the presence of CO2 gas in the surroundings. The sensitivity/response of a gas sensor is calculated and is found to be 60%. (The gas sensitivity is calculated by the following equation, S (%) = ((Rg – Ra))/Ra × 100)
Figure 9.

I–V characteristics of the sensor in air and a CO2 environment.
3.8. Sensor Integration with Arduino Microcontroller
The fabricated sensor is devised (Figure 10) with an Arduino microcontroller for transduction and gas concentration detection. The transduction from the chemical response by the sensor is due to the principle of the voltage divider. The sensor is considered an unknown resistor and a 55 kΩ known resistor. The voltage given to the circuit divides the voltage between two resistors, i.e., the sensor and the resistor, and the current and voltage in the sensor are measured with respect to the known resistance. Then, the resistance is converted to the gas concentration in terms of PPM.
Figure 10.

Sensor device components.
3.9. Conclusions
Graphene oxide (GO) was prepared by a modified Hummer’s method with CuO nanoparticles using CuCl2 as the precursor. UV–vis spectroscopy, SEM, and EDX analyses were used to characterize the prepared GO and CuO nanoparticles. The GO–CuO nanohybrid was prepared using the PVA–PVP mixture and was used for sensor fabrication. The sensor was fabricated using the copper-clad substrate, which is etched and coated with the nanohybrid by the Doctor Blade method. The sensor is then tested for the change in resistance using an SMU meter. The fabricated sensor is coupled with an Arduino for sensing the CO2 gas. The sensing response of this sensor toward CO2 is found to be 60%.
Acknowledgments
The authors extend their appreciation to the Deanship of Scientific Research at King Khalid University for funding this work through large group Research Project under grant number RGP2/209/44.
The authors declare no competing financial interest.
References
- Bennett S.A History of Control Engineering, 1930–1955, No. 47; The Institution of Engineering and Technology, 1993. [Google Scholar]
- Yan J..Machinery Prognostics and Prognosis-Oriented Maintenance Management; John Wiley & Sons, 2014. [Google Scholar]
- Watson J.. The tin oxide gas sensor and its applications. Sens. Actuators 1984, 5, 29–42. 10.1016/0250-6874(84)87004-3. [DOI] [Google Scholar]
- Zaaba N. I.; Foo K.; Hashim U.; Tan S.; Liu W. W.; Voon C. Synthesis of graphene oxide using modified hummers method: solvent influence. Procedia Eng. 2017, 184, 469–477. 10.1016/j.proeng.2017.04.118. [DOI] [Google Scholar]
- Robinson J. T.; Perkins F. K.; Snow E. S.; Wei Z.; Sheehan P. E. Reduced graphene oxide molecular sensors. Nano Lett. 2008, 8, 3137–3140. 10.1021/nl8013007. [DOI] [PubMed] [Google Scholar]
- Naik G.; Krishnaswamy S. Room-temperature humidity sensing using graphene oxide thin films. Graphene 2016, 05, 1–13. 10.4236/graphene.2016.51001. [DOI] [Google Scholar]
- Papamatthaiou S.; Argyropoulos D. P.; Farmakis F.; Masurkar A.; Alexandrou K.; Kymissis I.; Georgoulas N. The effect of thermal reduction and film thickness on fast response transparent graphene oxide humidity sensors. Procedia Eng. 2016, 168, 301–304. 10.1016/j.proeng.2016.11.201. [DOI] [Google Scholar]
- Meng F.-L.; Guo Z.; Huang X.-J. Graphene-based hybrids for chemiresistive gas sensors. TrAC, Trends Anal. Chem. 2015, 68, 37–47. 10.1016/j.trac.2015.02.008. [DOI] [Google Scholar]
- Li N.; Chen X.; Chen X.; Ding X.; Zhao X. Ultrahigh humidity sensitivity of graphene oxide combined with Ag nanoparticles. RSC Adv. 2017, 7, 45988–45996. 10.1039/c7ra06959f. [DOI] [Google Scholar]
- Taylor A. P.; Velásquez-García L. F. Electrospray-printed nanostructured graphene oxide gas sensors. Nanotechnology 2015, 26, 505301. 10.1088/0957-4484/26/50/505301. [DOI] [PubMed] [Google Scholar]
- Park J.; Cho Y. S.; Sung S. J.; Byeon M.; Yang S. J.; Park C. R. Characteristics tuning of graphene-oxide-based-graphene to various end-uses. Energy Storage Mater. 2018, 14, 8–21. 10.1016/j.ensm.2018.02.013. [DOI] [Google Scholar]
- Balashov S. M.; Balachova O.; Braga A.; Filho A. P.; Moshkalev S. Influence of the deposition parameters of graphene oxide nanofilms on the kinetic characteristics of the SAW humidity sensor. Sens. Actuators, B 2015, 217, 88–91. 10.1016/j.snb.2014.11.050. [DOI] [Google Scholar]
- Bannov A. G.; Prášek J.; Jašek O.; Shibaev A. A.; Zajíčková L. Investigation of ammonia gas sensing properties of graphite oxide. Procedia Eng. 2016, 168, 231–234. 10.1016/j.proeng.2016.11.169. [DOI] [Google Scholar]
- Tanvir N. B.; Yurchenko O.; Laubender E.; Urban G. Investigation of low temperature effects on work function-based CO2 gas sensing of nanoparticulate CuO films. Sens. Actuators, B 2017, 247, 968–974. 10.1016/j.snb.2016.11.020. [DOI] [Google Scholar]
- Kshirsagar J. M.; Shrivastava R.; Adwani P. S. Preparation and characterization of copper oxide nanoparticles and determination of enhancement in critical heat flux. Therm. Sci. 2017, 21 (1 Part A), 233–242. 10.2298/tsci140619026k. [DOI] [Google Scholar]
- Chand P.; Gaur A.; Kumar A. Study of CuO nanoparticles synthesized by sol-gel method. AIP Conf. Proc. 2011, 1393, 211–212. 10.1063/1.3653684. [DOI] [Google Scholar]
- Phiwdang K.; Suphankij S.; Mekprasart W.; Pecharapa W. Synthesis of CuO nanoparticles by precipitation method using different precursors. Energy Procedia 2013, 34, 740–745. 10.1016/j.egypro.2013.06.808. [DOI] [Google Scholar]
- Mirmotallebi M.; Iraji zad A.; Hosseini Z. S.; Jokar E. Characterization of three-dimensional reduced graphene oxide/copper oxide heterostructures for hydrogen sulfide gas sensing application. J. Alloys Compd. 2018, 740, 1024–1031. 10.1016/j.jallcom.2018.01.041. [DOI] [Google Scholar]
- Basu S.; Bhattacharyya P. Recent developments on graphene and graphene oxide based solid state gas sensors. Sens. Actuators, B 2012, 173, 1–21. 10.1016/j.snb.2012.07.092. [DOI] [Google Scholar]
- Wu J.; Feng S.; Li Z.; Tao K.; Chu J.; Miao J.; Norford L. K. Boosted sensitivity of graphene gas sensor via nanoporous thin film structures. Sens. Actuators, B 2018, 255, 1805–1813. 10.1016/j.snb.2017.08.202. [DOI] [Google Scholar]
- Yoon H. J.; Jun D. H.; Yang J. H.; Zhou Z.; Yang S. S.; Cheng M. M. C. Carbon dioxide gas sensor using a graphene sheet. Sens. Actuators, B 2011, 157, 310–313. 10.1016/j.snb.2011.03.035. [DOI] [Google Scholar]
- Tanvir N. B.; Wilbertz C.; Steinhauer S.; Köck A.; Urban G.; Yurchenko O. Work function-based CO2 gas sensing using metal oxide nanoparticles at room temperature. Mater. Today: Proc. 2015, 2, 4190–4195. 10.1016/j.matpr.2015.09.002. [DOI] [Google Scholar]
- Meng F.; Li X.; Yuan Z.; Lei Y.; Qi T.; Li J. Ppb-level xylene gas sensors based on Co3O4 nanoparticle-coated reduced graphene oxide (rGO) nanosheets operating at low temperature. IEEE Trans. Instrum. Meas. 2021, 70, 1. 10.1109/TIM.2021.3097858.33776080 [DOI] [Google Scholar]
- Zhang Y.; Zhu L.; Qin C.; Wang Y.; Cao J. Bimetal PtPd functionalized Bi2MoO6 microspheres for conductometric detection of CO: A combined experimental and theoretical study. Sens. Actuators, B 2023, 381, 133461. 10.1016/j.snb.2023.133461. [DOI] [Google Scholar]
- Yang Y.; Yang L.; Yang F.; Bai W.; Zhang X.; Li H.; Duan G.; Xu Y.; Li Y. A bioinspired antibacterial and photothermal membrane for stable and durable clean water remediation. Mater. Horiz. 2023, 10, 268–276. 10.1039/d2mh01151d. [DOI] [PubMed] [Google Scholar]
- Chen C.; Jiang M.; Luo X.; Tai H.; Jiang Y.; Yang M.; Xie G.; Su Y. Ni-Co-P hollow nanobricks enabled humidity sensor for respiratory analysis and human-machine interfacing. Sens. Actuators, B 2022, 370, 132441. 10.1016/j.snb.2022.132441. [DOI] [Google Scholar]
- Pan H.; Chen G.; Chen Y.; Di Carlo A.; Mayer M. A.; Shen S.; Chen C.; Li W.; Subramaniam S.; Huang H.; et al. Biodegradable cotton fiber-based piezoresistive textiles for wearable biomonitoring. Biosens. Bioelectron. 2023, 222, 114999. 10.1016/j.bios.2022.114999. [DOI] [PubMed] [Google Scholar]
- Meng F.; Wang H.; Yuan Z.; Zhang R.; Li J. Ppb-Level Triethylamine Gas Sensors Based on Palladium Nanoparticles Modified Flower-Like In 2 O 3 Grown on rGO Nanosheets Operating at Low Temperature. IEEE Trans. Instrum. Meas. 2022, 71, 1–9. 10.1109/tim.2022.3189731. [DOI] [Google Scholar]
- Qin W.; Yuan Z.; Gao H.; Meng F. Ethanol sensors based on porous In2O3 nanosheet-assembled micro-flowers. Sensors 2020, 20 (12), 3353. 10.3390/s20123353. [DOI] [PMC free article] [PubMed] [Google Scholar]
- Meng F.; Li X.; Yuan Z.; Lei Y.; Qi T.; Li J. Ppb-level xylene gas sensors based on Co 3 O 4 nanoparticle-coated reduced graphene oxide (rGO) nanosheets operating at low temperature. IEEE Trans. Instrum. Meas. 2021, 70, 1–10. 10.1109/tim.2021.3097858.33776080 [DOI] [Google Scholar]
- Sudha D.; Kumar E. R.; Shanjitha S.; Munshi A. M.; Al-Hazmi G. A.; El-Metwaly N. M.; Kirubavathy S. J. Structural, optical, morphological and electrochemical properties of ZnO and graphene oxide blended ZnO nanocomposites. Ceram. Int. 2023, 49, 7284–7288. 10.1016/j.ceramint.2022.10.192. [DOI] [Google Scholar]
- Patil V. B.; Malode S. J.; Mangasuli S. N.; Tuwar S. M.; Mondal K.; Shetti N. P. An electrochemical electrode to detect theophylline based on copper oxide nanoparticles composited with graphene oxide. Micromachines 2022, 13, 1166. 10.3390/mi13081166. [DOI] [PMC free article] [PubMed] [Google Scholar]
- Ebrahimi Naghani M.; Neghabi M.; Zadsar M.; Abbastabar Ahangar H. Synthesis and characterization of linear/nonlinear optical properties of graphene oxide and reduced graphene oxide-based zinc oxide nanocomposite. Sci. Rep. 2023, 13, 1496. 10.1038/s41598-023-28307-7. [DOI] [PMC free article] [PubMed] [Google Scholar]
- Khan A.; Kamal T.; Saad M.; Ameen F.; A. Bhat S.; Ahamad Khan M.; Rahman F. Synthesis and antibacterial activity of nanoenhanced conjugate of Ag-doped ZnO nanorods with graphene oxide. Spectrochim. Acta, Part A 2023, 290, 122296. 10.1016/j.saa.2022.122296. [DOI] [PubMed] [Google Scholar]
- Yang C.; Shen Z.; Yao C.; Huang S.; Huang X.; Mo J.; Yang C.; Chen M.; Chen H. J.; Hang T.; et al. Integrated Strain Sensors with Stretchable Vertical Graphene Networks for Non-invasive Physiological Assessment. ACS Appl. Electron. Mater. 2022, 4, 964–973. 10.1021/acsaelm.1c01097. [DOI] [Google Scholar]
- Ghasemi F.; et al. Paper based optical nanosensors-A review. Anal. Chim. Acta 2023, 1238, 340640. 10.1016/j.aca.2022.340640. [DOI] [PubMed] [Google Scholar]
- Chekired F.; Taabli O.; Khellili Z. M.; Tilmatine A.; de Almeida A. T.; Canale L. Near-Zero-Energy Building Management Based on Arduino Microcontroller—On-Site Lighting Management Application. Energies 2022, 15, 9064. 10.3390/en15239064. [DOI] [Google Scholar]