
Figure 3.
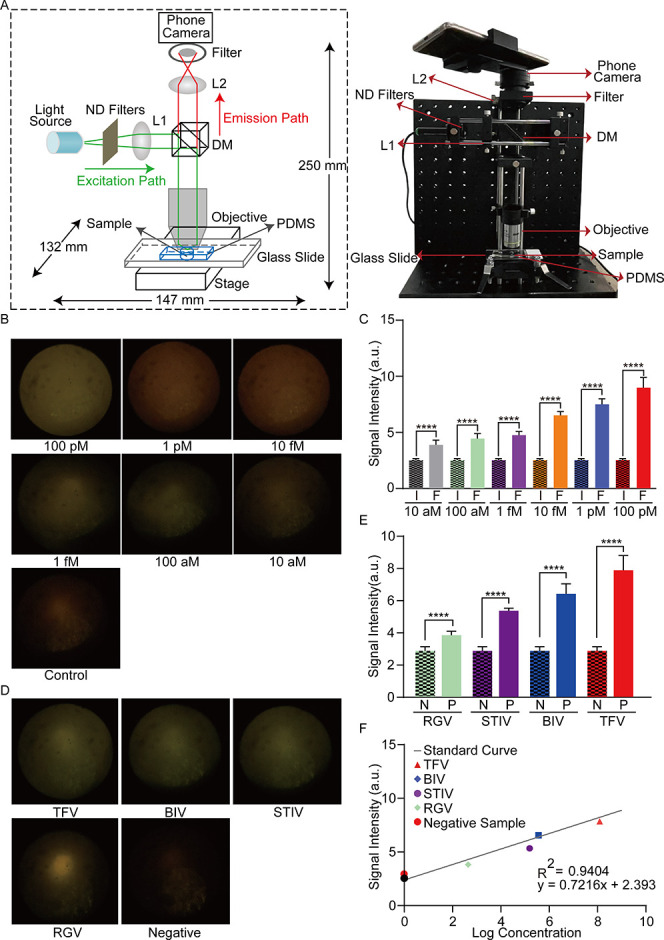
Detection of FV3 with RPA-CRISPR/Cas12a-SPM. (A) Schematic of SPM for fluorescence detection (left). The physical appearance of the assembled device used for fluorescence image collection after the RPA-CRISPR/Cas12 reaction (right). (B) Fluorescence images of RPA-CRISPR reactions with the purified target DNA or control DNA. (C) The statistics of the signal intensity for fluorescence images collected in RPA-CRISPR reactions with various concentrations of purified fragments: F, FV3; I, ISKNV. (D) The SPM images of the positive and negative animal-derived samples in the RPA-CRISPR/Cas12a detection assay. (E) The statistics of the signal intensity of fluorescence images from animal-derived samples: P, positive; N, negative. (F) The fluorescence signal intensity of animal-derived samples and their absolute concentration detected by qPCR. The Student’s two-sample t-test is used for statistical analysis. *p < 0.05, **p < 0.01, ***p < 0.001, ****p < 0.0001, and N.D. indicates no difference.