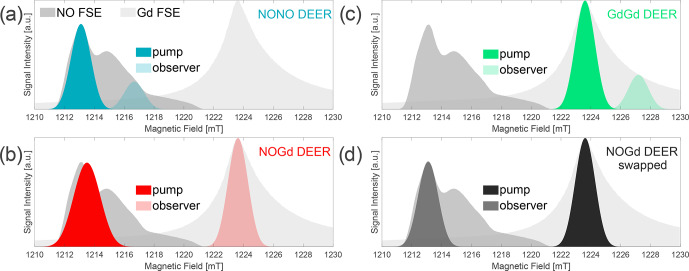
Figure 3.
Three-channel DEER setups. Two field-swept echo (FSE) spectra of NO and Gd are represented as shaded gray areas, superimposed at their relative spectral positions. Gaussian pulse excitation profiles are shown at the respective pump and observer positions, simulated with EasySpin 5.2.2 and using the provided functions of “pulse” and “exciteprofile”. The excitation profiles represent ideal Gaussian pulses without taking into account the spectral shape, the nonlinearity of the signal response, the resonator profile, or the Q factor. Therefore, they are only indicative of the excitation bandwidth of the pulses. Nevertheless, we found that the correct choice of the pulse lengths and a positioning of the pump and observer frequencies in such a way that the two simulated excitation profiles do not overlap allow us to experimentally minimize the “ ” signal at the end of DEER traces . In setups (a–c), Gaussian observer pulses of 32 ns time base length (13.6 ns FWHM) for and were used in combination with a shot repetition time (srt) of 1000 s. (a) NONO DEER – a 32 ns Gaussian pump at the spectral maximum of NO, with observer pulses 100 MHz lower in frequency and the pump/observer placed symmetrically in the resonator profile. Performed at 50 K. (b) NOGd DEER – 32 ns Gaussian observer pulses at the spectral maximum of Gd, with a Gaussian pump pulse of 24 ns (10.2 ns FWHM) placed in the center of the resonator profile (minimum possible pulse length in our setup) at 280 MHz higher in frequency than the observer. Performed at 10 K. (c) GdGd DEER – as in (a), except for the pump pulse being placed on the maximum of the Gd spectrum. Performed at 10 K. (d) Swapped NOGd DEER setup – the 32 ns Gaussian observer pulses at the spectral maximum of NO, with a 32 ns Gaussian pump pulse 291 MHz lower in frequency than the observer. Performed at 30 K with a srt of 10 000 s. The observer was placed MHz off-center in the resonator profile.

