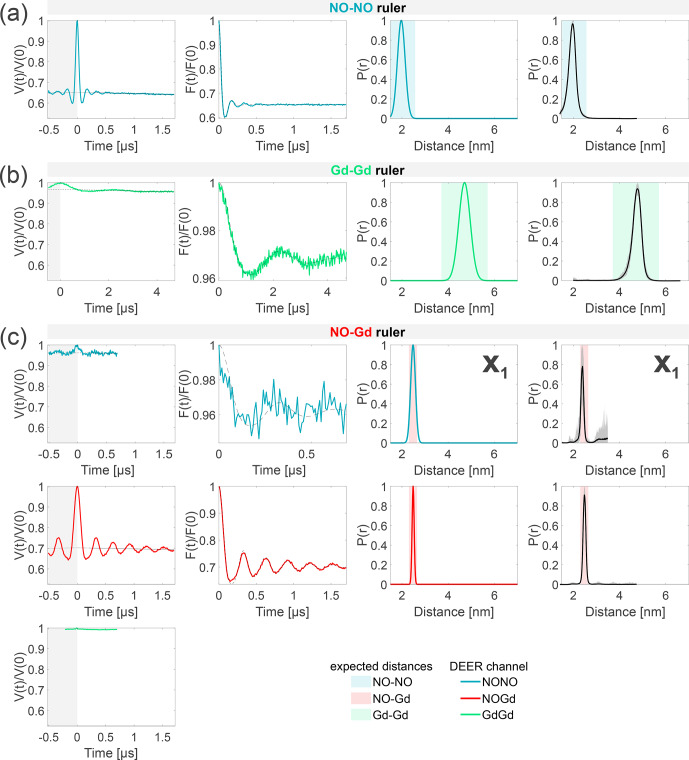
Figure 4.
Characterization of the isolated rulers. The DEER setups are introduced in Fig. . The first column shows the primary data with background fit (gray areas are excluded from data evaluation). The second column shows the form factors (obtained by dividing the primary data by the background function) with the fit from the Gaussian fitting routine. The third column shows the obtained distance distributions. The fourth column shows the DEERNet analysis (generic network) done to provide an error estimation. A Tikhonov analysis of the data is shown in Fig. S4 (part B). An overview over of DEER data is given in Table S5 (part B). The time traces, form factors, and distance distributions recorded with the NONO DEER channel are colored in blue, those recorded with the GdGd channel are colored in green, and those recorded with the NOGd channel are colored in red. Regions in which distances can be expected based on the rulers present in the specific sample are represented as shaded blue, green, and red areas in the distance distributions. is a NO–Gd crosstalk in the NONO DEER channel.

