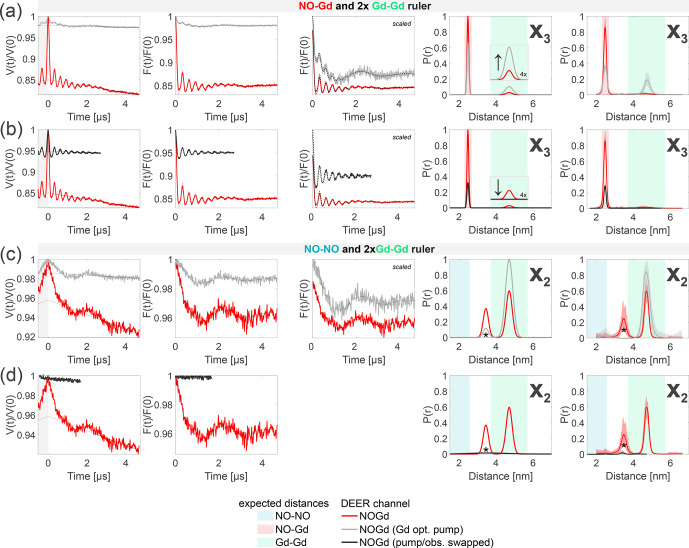
Figure 9.
Crosstalk signal identification and suppression. The first column shows the primary data with background fit (gray areas are excluded from data evaluation). The second column shows the form factors with the fit obtained with a Gaussian fitting routine. The third column shows the form factors scaled to the same modulation depth and offset by a constant value. The fourth column shows the distance distributions obtained. The fifth column shows the DEERNet analysis (generic network) used to provide an error estimation. (a–b) Sample containing the NO–Gd and the Gd–Gd rulers mixed in a molar ratio (related to Fig. ). The NOGd channel contains a Gd–Gd crosstalk signal in presence of a NO–Gd distance ( ). (a) Decreasing the pump pulse power in the standard NOGd DEER setup (see Fig. b), from optimally pumping NO (red) to optimally pumping the Gd ( dB; gray), changes the signal-to-crosstalk ratio and, thereby, allows the identification of the crosstalk signal. (b) By pumping the Gd and observing on the NO (swapped NOGd DEER setup; see Fig. d) the Gd–Gd crosstalk signal can be fully removed from the NOGd DEER channel (black). (c–d) Sample containing the NO–NO and the Gd–Gd rulers mixed in a molar ratio (related to Fig. ). The NOGd DEER channel contains a Gd–Gd crosstalk signal in absence of a NO–Gd distance ( ). The distance, indicated with an asterisk, originates from a spectrometer artifact. (c) Analogous to (a). (d) Analogous to (b).

