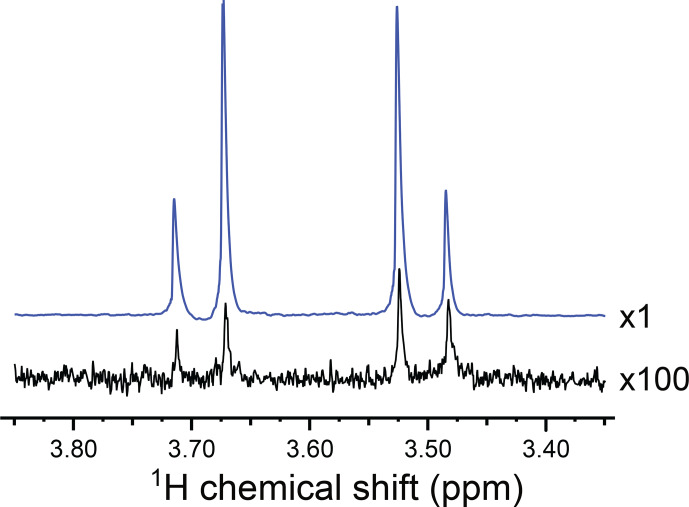
Figure 2.
Partial NMR spectra of the reaction products at a resonance frequency of 400.0 MHz and temperature of 333 K, showing the signals from the group of I. The hyperpolarized spectrum (blue) was acquired in a gem-PHIP experiment using the pulse sequence in Fig. a, with the intervals s and s. The spectrum in black was obtained by waiting 90 s after the conclusion of the experiment and taking the Fourier transform of the NMR signal induced by a single pulse. The spectrum shows an AB peak pattern, with intensity distortions from residual hyperpolarization. The AB spectrum is consistent with a chemical shift difference of ppm and a two-bond coupling of Hz. The signal enhancement factor in the gem-PHIP experiment is estimated to be , which corresponds to a polarization level of %.

