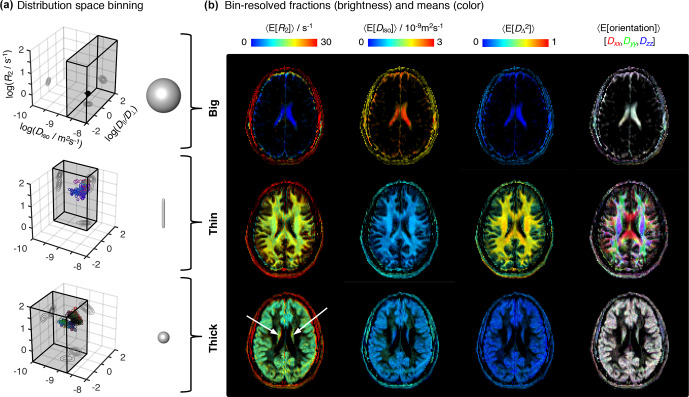
Figure 4.
Parameter maps with bin-resolved means of the relaxation–diffusion distributions. (a) Division of the - distribution space into different bins. The distribution space was separated into three bins (gray volumes) named “big”, “thin”, and “thick” that loosely capture the diffusion features of cerebrospinal fluid CSF, white matter WM, and gray matter GM, respectively. The 3D scatter plots display the nonparametric - distributions corresponding to the CSF (top), WM (middle), and GM (bottom) voxels selected in Fig. 2. Superquadric tensor glyphs are used to illustrate the representative captured by each bin. (b) Parameter maps of average per-bin means (color) of transverse relaxation rate , isotropic diffusivity , squared anisotropy , and diffusion tensor orientation [Orientation] . The orientation maps (column 4) are color-coded as [R,G,B] , where are the diagonal elements of laboratory-framed average diffusion tensors estimated from the various distribution bins. Brightness indicates the signal fractions corresponding to the big (row 1), thin (row 2), and thick (row 3) bins. The white arrows identify deep gray-matter structures.

