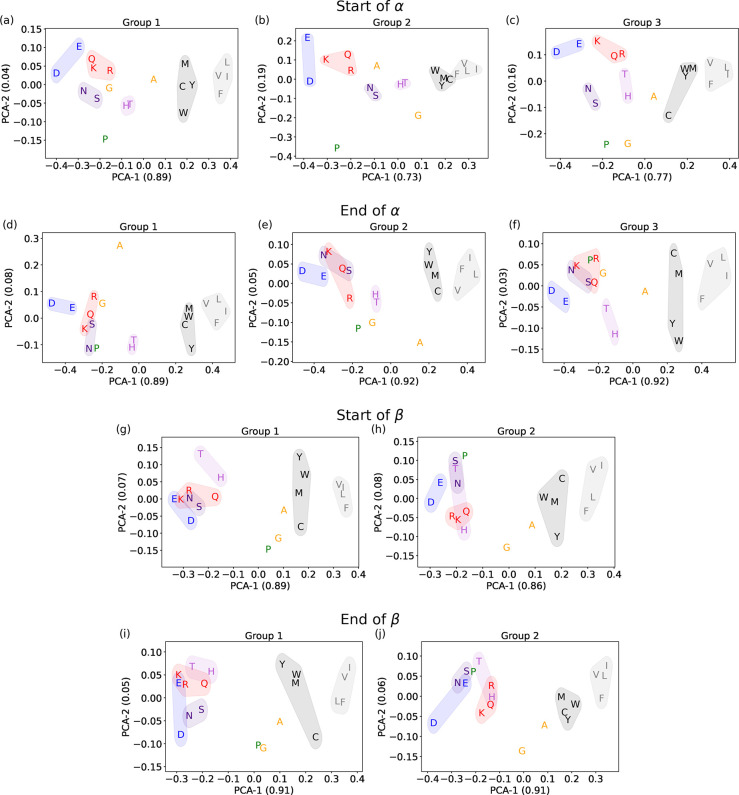
Figure 8.
Principal component analysis of amino acid weights. Each panel shows the first two components of the PCA for each amino acid in a hidden-unit group for a given part of the secondary structure. The numbers in the axis labels in the parentheses are the average explained variances. Color-shaded ensembles and single amino acids are discussed in the text. (a–c) Groups at the start of α-helices, shown in Figure 4. (d–f) Groups at the end of α-helices (Figure 5). (g, h) Groups at the start of β-sheets (Figure 6). (i, j) Groups at the end of β-sheets (Figure 7).

