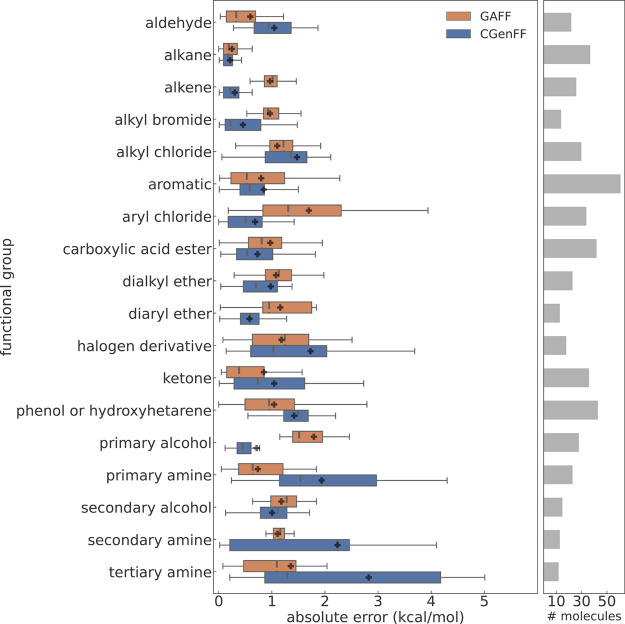
Figure 5.
Box-like plot of the ASFE results for groups of molecules sharing the same chemical functionality; results are only shown when there are at least 10 molecules belonging to a group in the database. The classification into functional groups follows the original work by Mobley and Guthrie.23 Left: the absolute error compared to the experiment, obtained with transformato/CGenFF (blue, this work) and GAFF23 (orange) are shown in a box plot-like manner. For each calculated ASFE, the absolute deviation from its experimental value is calculated, grouped and assigned to the corresponding functional group. The black crosses indicate the mean absolute error (MAE) for a particular group. The whiskers indicate the molecules with minimal and maximal deviation from the experimental ASFE. The bars depict the range from the first to the third quantile of the MAE values. The median absolute error is indicated as a thin, dashed vertical line. Right: the gray bars indicate the number of molecules belonging to a group.

