Figure 5.
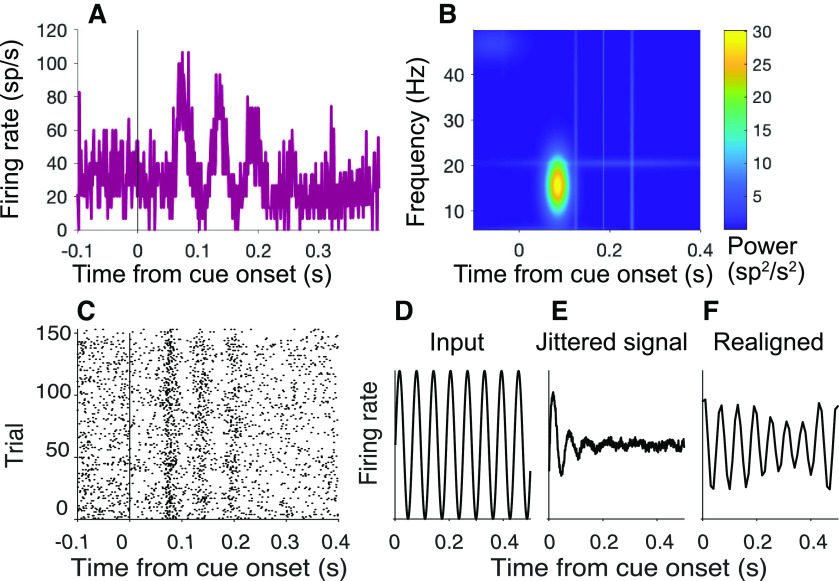
Detection of oscillations. A, B, Oscillations in spiking activity measured using the MP algorithm. The algorithm uses a greedy method to fit the waveform using a dictionary of Gabor functions of time (Eq. 6). A, Input to MP algorithm. The average firing rate is rendered as a peristimulus time histogram (1 ms bin width) aligned to cue onset (neuron Dm49; same 150 trials shown in Fig. 4A). B, Output of MP algorithm. Heat map represents power (color) by frequency and time from cue onset. C–F, Realigning does not identify additional peaks. C, Activity of example cell Dm49 at cue onset realigned using the affinewarp algorithm (Williams et al., 2020). D–F, Affinewarp can recover temporally jittered oscillations in synthetic data. D, Input oscillation. E, Mean activity of 500 simulated trials using the firing rate function in D, with added temporal jitter. For each trial, temporal noise is added at each time point before generating spikes, causing the oscillations to become misaligned in time and to disappear from the average. F, Average firing rate of the activity of the trials shown in E after applying the affinewarp algorithm. The underlying oscillation is partially recovered.

