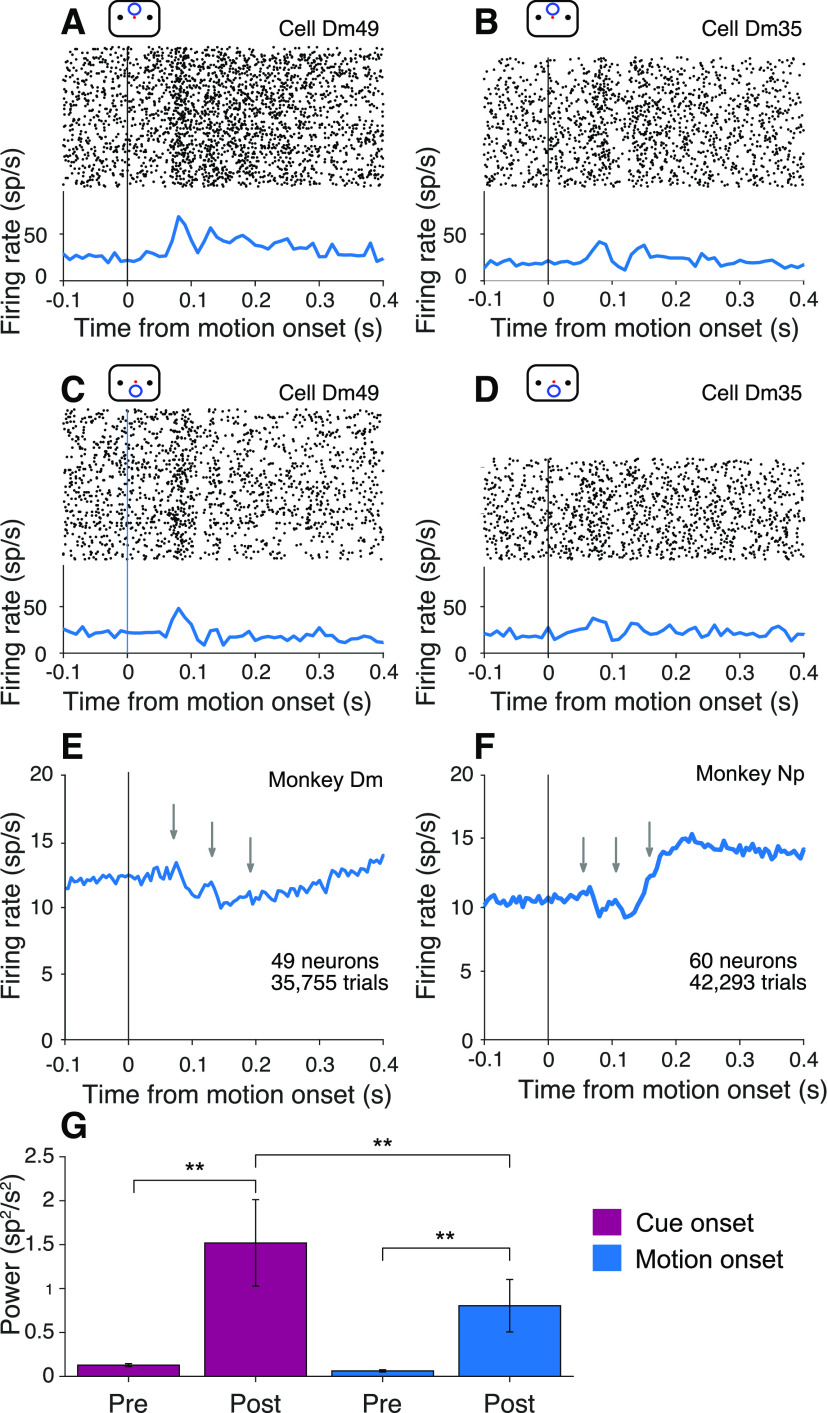
Figure 6.
Oscillations at motion onset in the cued attention task. A–D, Activity of the neurons shown in Figure 4A-D, aligned here to the onset of random dot motion. Attention was cued to the upper patch in A and B and to the lower patch in C and D. E, F, Average activity across all neurons in both locations. Gray arrows indicate the positions of the peaks in activity in Figure 4E, F. G, Average and , across all neurons from both monkeys, in 90 ms epochs before and after onset of the attention cue and random dot motion stimulus. *α = 0.05. **α = 0.01. Error bars indicate SEM.

