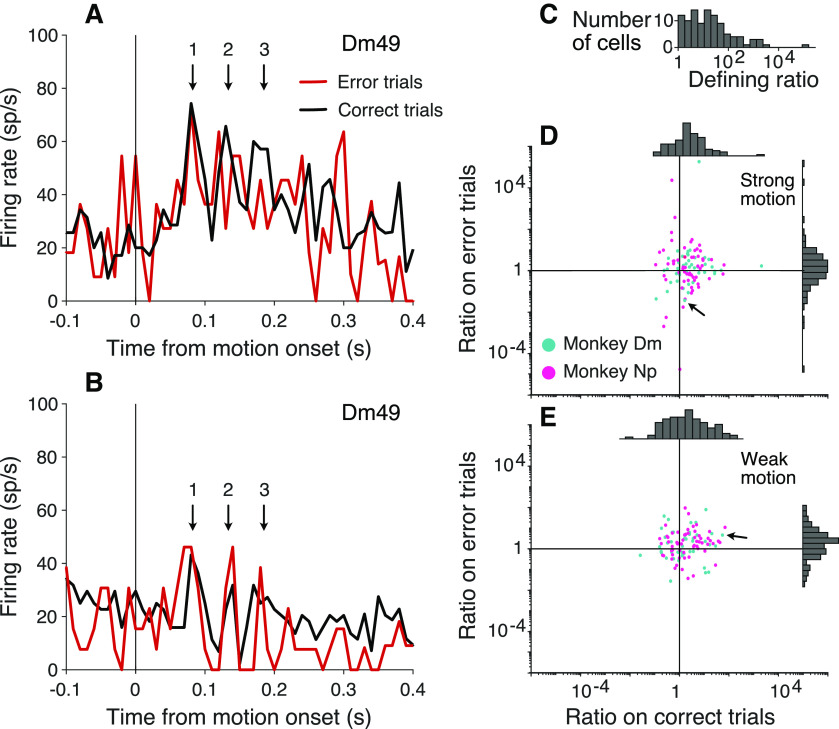
Figure 7.
Oscillation amplitude tracks misrouting errors. The analysis exploits the observation that some neurons exhibit consistently stronger oscillations at the onset of motion when the upper or lower patch is cued. The example neuron (Dm49) shows stronger oscillations when the upper patch is cued. A, Activity of Dm49 aligned to the onset of strong motion when the cued patch is above the FP. Colors represent correct (black) and error trials (red). The oscillation is weaker on error trials (e.g., cycles 2 and 3; arrows). B, Same as in A, when the cued patch is below the FP. The oscillation is stronger on error trials (all three cycles). C, Histogram of the ratio of oscillation strengths at the preferred over nonpreferred locations, across all trials. By definition, ratio > 1. Note the logarithmic scale. D, E, Scatter plots represent the ratio of oscillation strengths at the preferred over nonpreferred locations for each neuron on correct choices versus errors. Arrows in both graphs identify Dm49. D, Trials with strong motion, where errors are predominantly because of misrouting. On correct trials, the preferred location is more strongly oscillating (ratio > 1). On error trials, many cells exhibit weaker oscillations when the preferred location is cued (ratio < 1). E, Trials with weak motion, where errors are predominantly perceptual. The ratios do not differ for correct choices versus errors.

