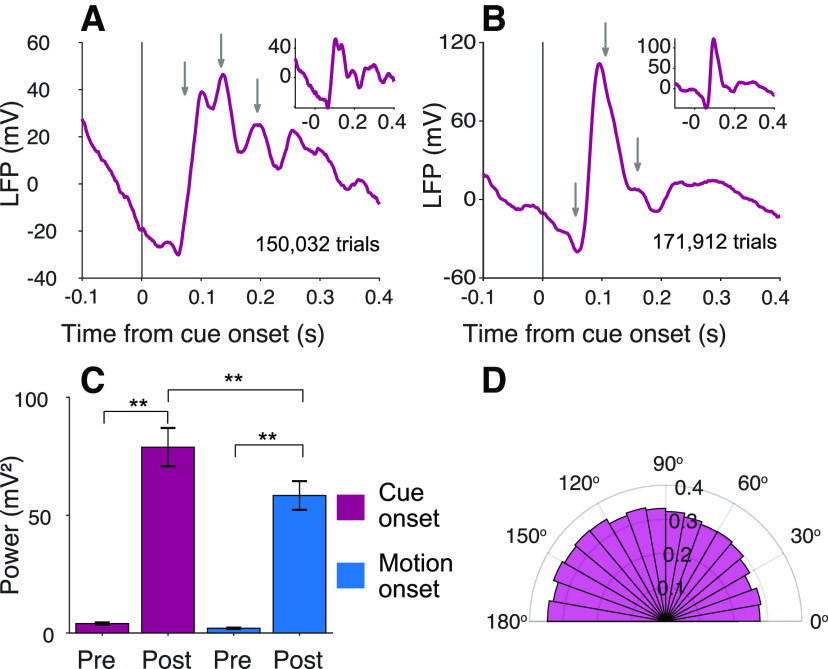
Figure 8.
Oscillations are present in the LFP. A, B, Average baseline-corrected LFP from monkeys Dm and Np, respectively, aligned to onset of the attention cue in the cued attention task. Gray arrows indicate the peaks in firing rate activity shown in Figure 4E, F. Insets, The same signal for channels where no neurons were identified. C, Average and , across all sites and both monkeys, measured in 90 ms epochs preceding and following onset of the attention cue and random dot motion. Same conventions as in Figure 6. D, Phase alignment of spikes with LFP. Histogram represents the number of spikes in 30° bins of phase. The phases refer to the cosine carrier of the best Gabor. There is a tendency for spikes to occur more frequently near the trough of the LFP (see Spike-field alignment).

