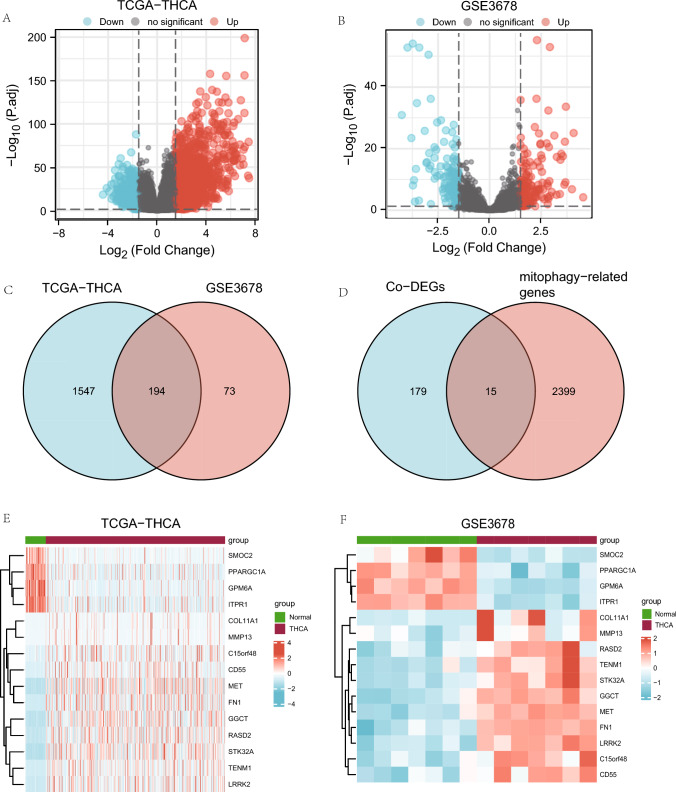
Fig. 2.
Analysis of mitophagy-associated differentially expressed genes (DEGs) in ThyC. A A volcano plot of DEGs from the TCGA-ThyC dataset comparing cancer tissues (grouping: tumor) and surrounding non-malignant tissues (grouping: normal). B A volcano plot of DEGs in ThyC from the GSE3678 dataset. C DEGs from both TCGA-ThyC and GSE3678 datasets were analyzed for co-DEGs using a Venn diagram. D A Venn diagram of shared co-DEGs between two datasets and genes related to mitophagy. Co-DEGs: Common differentially expressed genes. Complex numerical heat map of mitophagy-related genes with differential expression in the TCGA-ThyC dataset (E) and GSE3678 dataset (F). Thyroid cancer: ThyC

