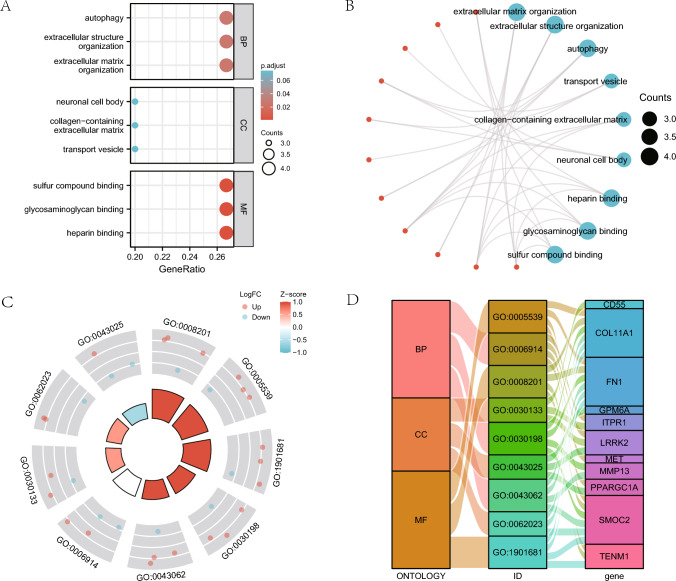
Fig. 3.
Functional gene ontology (GO) enrichment analysis of mitophagy-related DEGs. A The bubble plot shows findings of the GO analysis of mitophagy-related DEGs. B The GO analysis results of DEGs related to mitophagy are presented in the circular network diagram. C A circle diagram of GO analysis results combined with a logFC analysis of mitophagy-related DEGs. D The Sankey plot displays the findings of the GO analysis of mitophagy-associated DEGs. In the bubble plot (A), the color of the bubble denotes the activation or inhibition of GO terms, and the ordinates are the GO terms. Red represents activation, and blue represents inhibition. In the circular network diagram (B), genes are shown by red dots, whereas pathways are represented by blue circles. In the circle diagram (C), the red dots stand for up-regulated genes (logFC > 0) and the blue dots for down-regulated genes (logFC < 0). GO gene ontology, BP biological process, CC cell component, MF molecular function. The screening criteria for GO enrichment items were P < 0.05 and FDR < 0.05

