
Fig. 4.
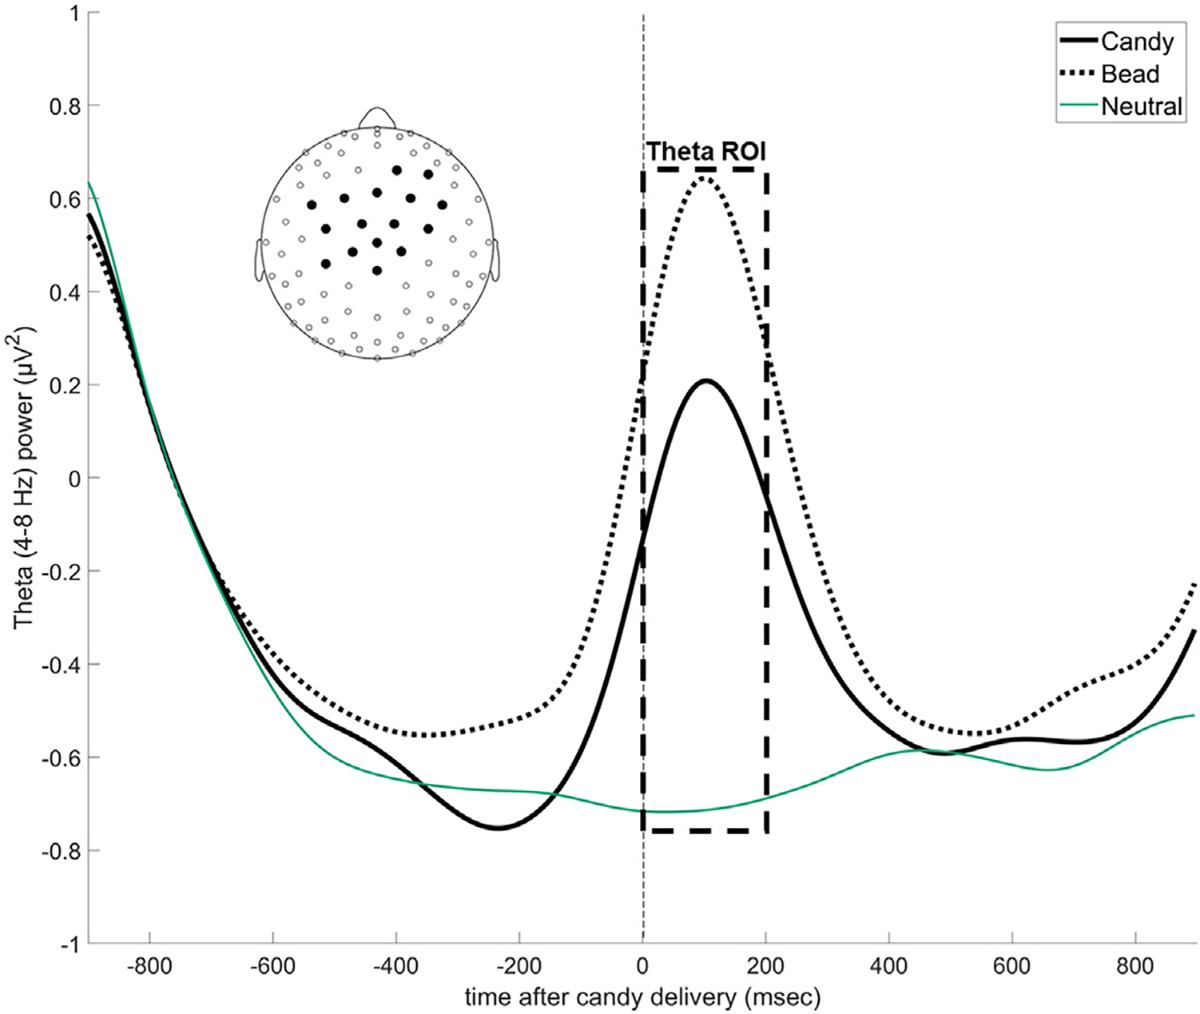
Time series data showing changes in average theta power over mid-frontal scalp sites during the candy, bead & neutral experimental conditions. Theta power over midfrontal scalp sites (see inset for EEG electrode locations) increases during the candy and bead conditions but not when the participant is passively viewing neutral pictures. The box indicates the temporal ROI used to calculate theta power. The candies and beads were delivered at time 0.