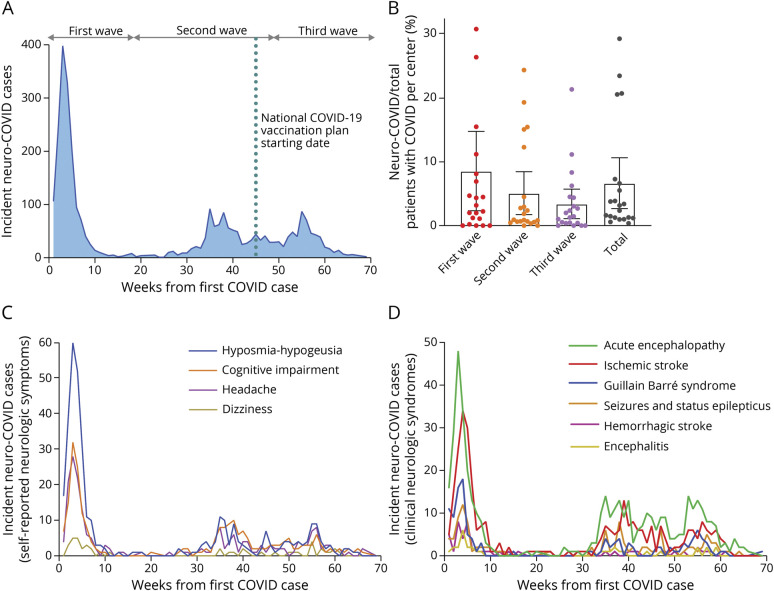
Figure 1. Incidence Dynamics of Neuro-COVID Disorders.
Intrapandemic incidence of neuro-COVID cases (A) and their proportion relative to all hospitalized COVID cases (B; each dot represents a recruiting center). Incidence is represented separately for selected self-reported neurologic symptoms (C) and clinical neurologic syndromes (D). COVID = coronavirus disease.

