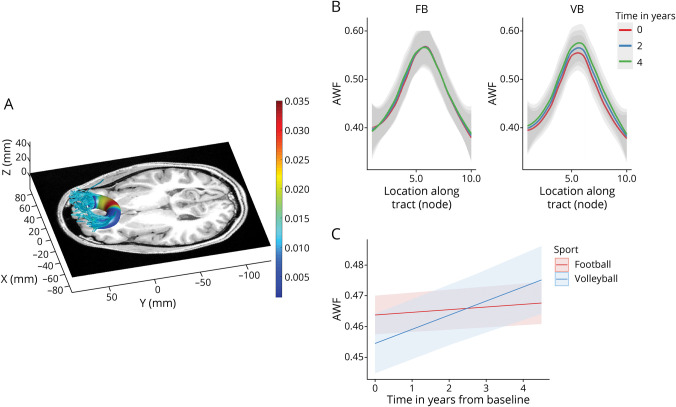
Figure 2. Divergent AWF Trajectory Between Football and Volleyball Players in the Callosum Forceps Minor (Highlighted From Table 2).
(A) Rendering of localized effects. Tractography was performed on a representative volleyball scan. Color coding indicates the node-wise predicted AWF difference between sports using a 3-way interaction model—red indicates larger and blue indicates smaller group differences/effects. (B) Plot of AWF values along the tract nodes (parameterized location 1–10) for football (FB) and volleyball (VB) players for different time points of the study (0 years—red, 2 years—blue, and 4 years—green). (C) The trajectories of AWF values over time across the whole tract, as estimated by the nested linear mixed-effects model, for football (red) and volleyball (blue) players. AWF = axonal water fraction.

