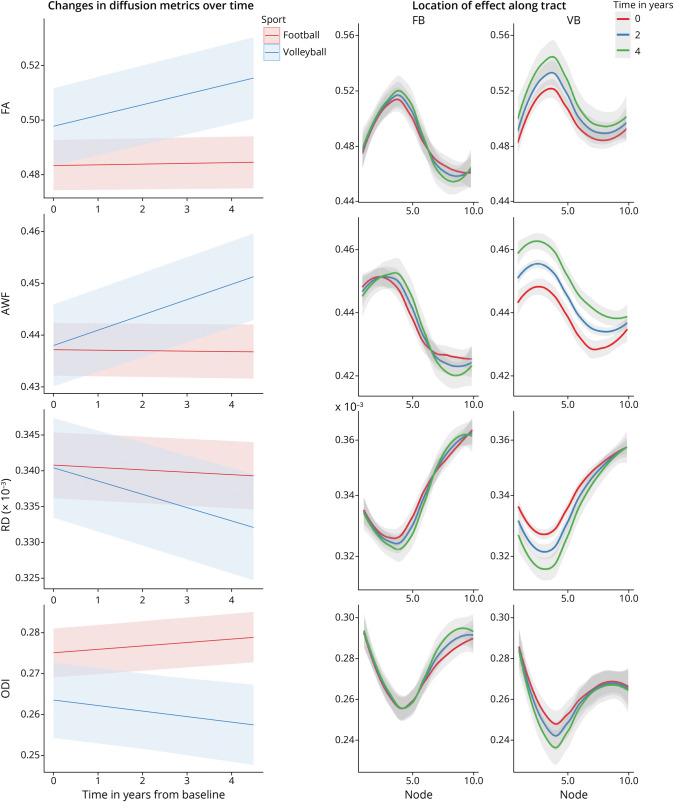
Figure 3. Longitudinal Diffusion Metrics in Left Superior Longitudinal Fasciculus (SLF) in Football (FB) vs Volleyball (VB) Players.
Left: The trajectories of diffusion metrics values over time across the whole SLF, as estimated by the nested linear mixed-effects model, for football (red) and volleyball (blue) players. Right: The same diffusion metrics for football (FB, left column) and volleyball (VB, right column), plotted along the tract nodes (parameterized location 1–10), for 3 distinct time points over the course of the study (0 years—red, 2 years—blue, and 4 years—green).

