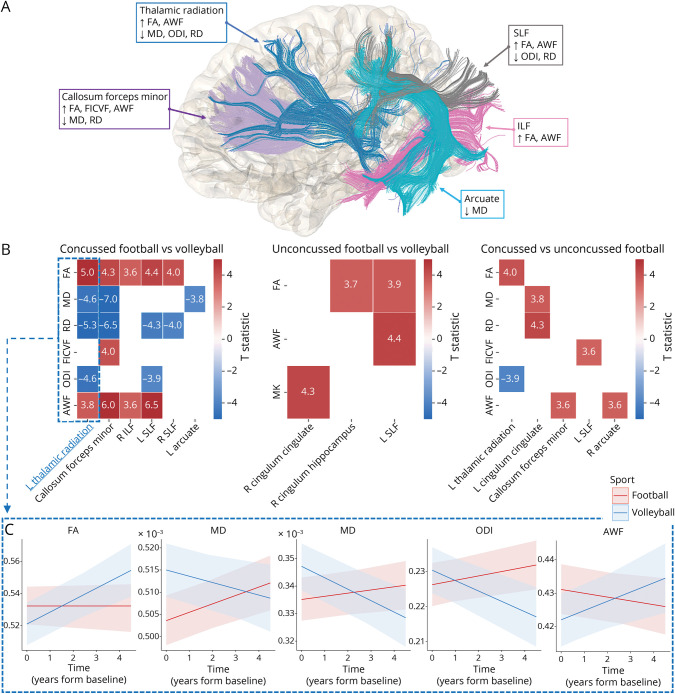
Figure 4. Longitudinal Comparison Between (1) Volleyball Players, (2) Football Players With Prior or In-Study Concussion (Concussed), or (3) Without Concussion (Unconcussed).
(A) Summary of tract-specific findings for volleyball vs concussed football players. Upward and downward arrows within each box represent significant longitudinal metric increases and decreases, respectively, in volleyball compared with concussed football players within respective tracts. (B) Heatmaps summarizing tract-specific findings across all comparisons between the 3 groups. Longitudinal changes were more prominent and observed in more tracts when volleyball was compared with concussed football players (left). Heatmap values represent the T-statistic of the “Group x Time” variable from the nested mixed-effect models. Nonsignificant findings are depicted as blank cells. (C) Trajectories of diffusion metric values over time across the left thalamic radiation, as estimated by the nested linear mixed-effects model, for concussed football (red) and volleyball (blue) players.

