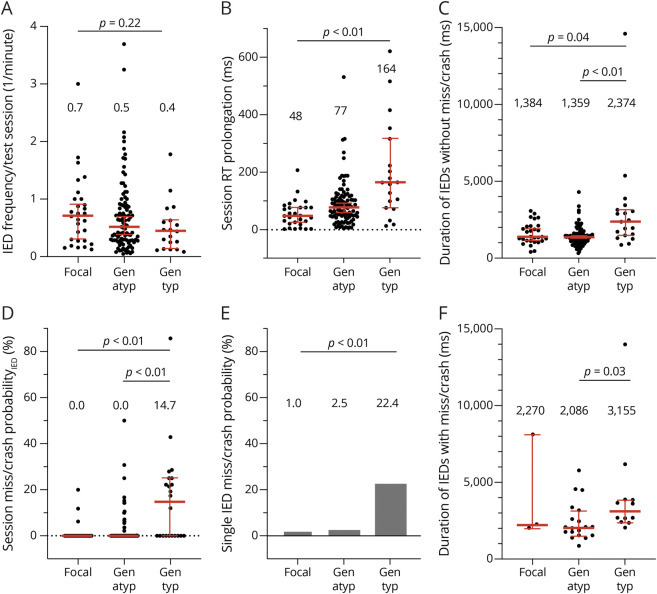
Figure 2. RT Prolongation and Miss/Crash Vary With IED Type and IED Duration.
(A) The number of IEDs from test sessions classified as having predominant focal, generalized atypical (gen atyp), or generalized typical (gen typ) IEDs was divided by the respective duration of the test session in minutes to get a metric of IED frequency. Each point of the scatter plot corresponds to the IED frequency of a session. The metric was presented as median with 95% CI in red (medians written above scatter plots). (B) IEDs without miss/crash generally resulted in RT prolongation. RT prolongation of each session (represented as 1 point) was grouped according to the IED type of the session. The appropriately grouped RT prolongations were presented as median with 95% CI. (C) The average duration of IEDs without miss/crash of each session (represented as 1 point) was grouped according to the IED type of the session. The median with 95% CI is shown for each group of IED durations. (D) At the session level, IED-associated missed reactions in the flash test and simulator and IED-associated crashes in the car test were divided by the total number of stimulus exposures during IED (each point corresponds to the miss/crash probabilityIED of a session). Miss/crash probabilitesIED were grouped by IED type and presented as median with 95% CI. (E) To calculate the single IED burst miss/crash probability separately for each IED type, the session level was resolved. Of all sessions classified as focal, generalized atypical, or generalized typical, the respective total number of IEDs with misses/crashes was divided by the respective total number of stimulus exposures during each IED. This plot is intended to complement the session miss/crash probabilityIED in (D) to show that miss/crash did occur in sessions that were classified as focal or generalized atypical. (F) The session average of IED duration for IEDs with miss/crash (shown as 1 point) was grouped according to the IED type of the session. The descriptive statistics used was the median with 95% CI (in red). IED = interictal epileptiform discharge.

