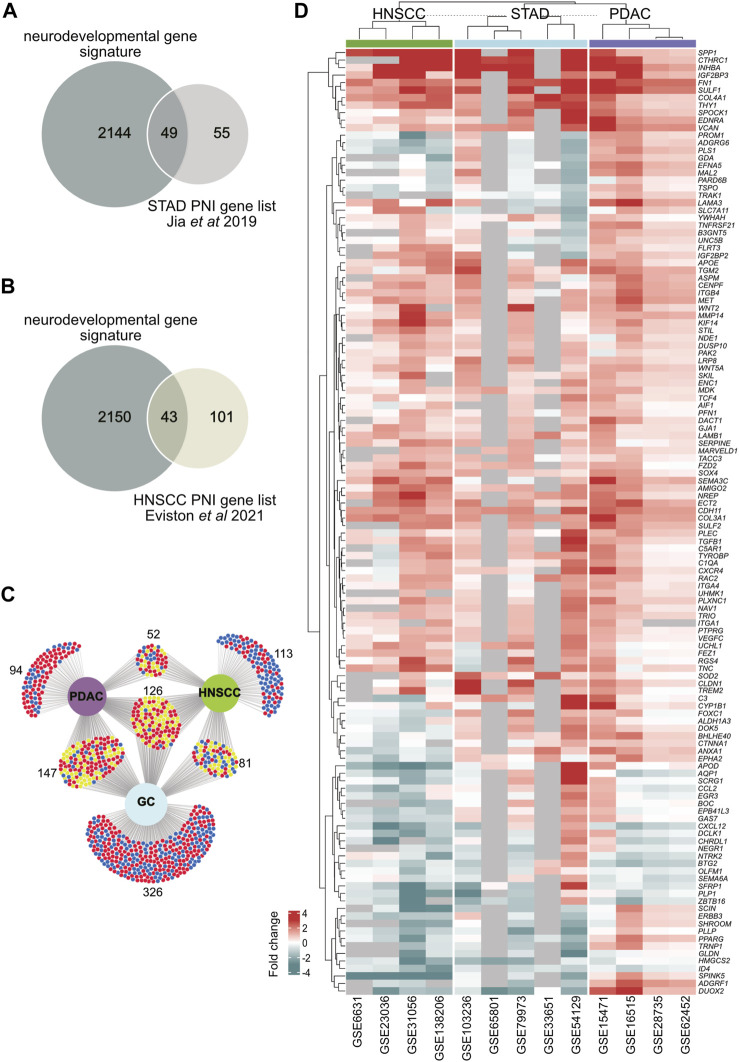
FIGURE 3.
Identification of neurodevelopmental DEGs in head and neck squamous cell carcinoma (HNSCC), pancreatic ductal adenocarcinoma (PDAC), and stomach adenocarcinoma (STAD). (A) A Venn diagram showing the intersection analysis between a gastric cancer PNI gene list constructed from Jia et al. (2019) and a neurodevelopmental gene signature in this paper. (B) A Venn diagram showing the intersection analysis between a HNSCC PNI gene list constructed from Eviston et al. (2021) and a neurodevelopmental gene signature in this paper. (C) DEGs from all cancer datasets were cross-referenced with the neurodevelopmental gene signature. An intersection analysis of neurodevelopmental DEGs from PDAC, HNSCC, and STAD is shown. 372 neurodevelopmental DEGs were found in HNSCC, 419 in PDAC, and 680 in STAD. There were 126 neurodevelopmental DEGs common to all cancers in any dataset from each cancer. Significantly downregulated and upregulated DEGs are delineated with blue and red, respectively. Genes that are either down or upregulated depending on the cancer type are depicted in yellow. (D) A hierarchical clustering heatmap of the 126 DEGS common to PDAC, HNSCC and GC in (C) is shown. Genes that were not annotated for a given dataset are shown in gray. The expression fold change values are depicted by the intensity of color along a red (upregulated) to blue (downregulated) scale as indicated on the diagram. Abbreviations: DEG, differentially expressed gene; HNSCC, head and neck squamous cell carcinoma; PDAC, pancreatic ductal adenocarcinoma; STAD, stomach adenocarcinoma; PNI, perineural invasion.

