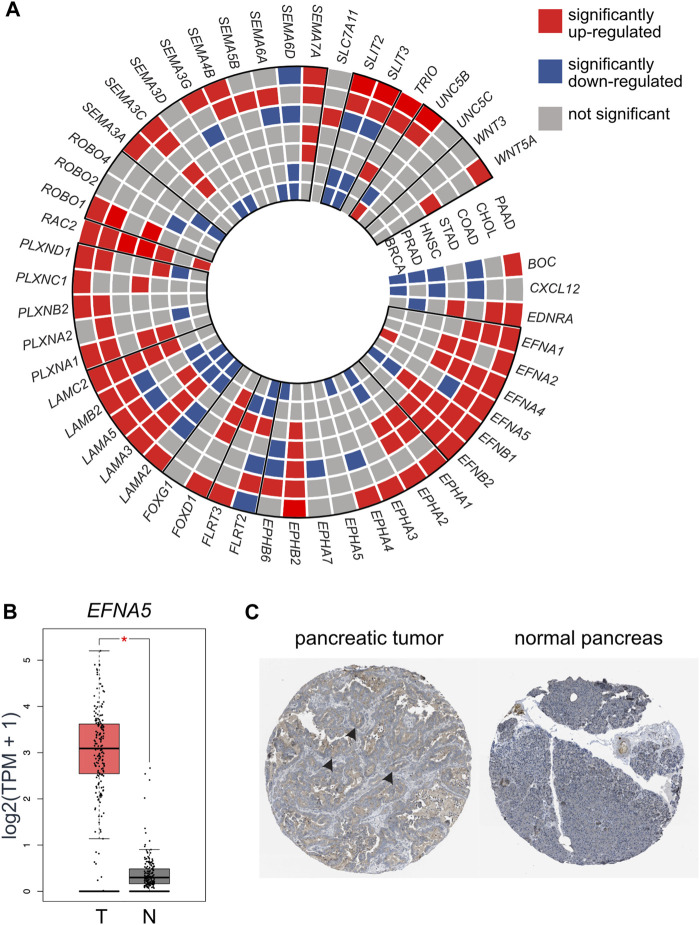
FIGURE 5.
TCGA dataset analysis revealed axon guidance genes were dysregulated in a broad range of cancers associated with PNI. (A) A wheel chart depicting dysregulated axon guidance genes in the TCGA datasets. Cancer types are depicted as concentric circle layers and individual genes depicted as slices. Paralog genes are grouped with a bold outline. Significantly upregulated (red), downregulated (blue), and genes which did not reach statistical significance (gray) between tumor and control tissues are depicted. (B) mRNA expression of selected gene EFNA5 in PAAD (Tumor (T) = 179 samples) and normal pancreas from TCGA and GTEx cohorts (normal (N) = 171 samples). (C) Immunohistochemistry of an example differentially expressed molecule EFNA5 in pancreatic tumor (https://www.proteinatlas.org/ENSG00000184349-EFNA5/pathology/pancreatic+cancer#32836_B_4_2) and normal pancreas (https://www.proteinatlas.org/ENSG00000184349-EFNA5/tissue/pancreas#32837_A_3_3) image credit: Human Protein Atlas version 22 proteinatlas.org (Uhlén et al., 2015; Uhlen et al., 2017), arrow heads depict overexpression of EFNA5 (brown staining) in the tumor sample. Abbreviations: PNI, perineural invasion; BRCA, breast cancer; PRCA, prostate cancer; HNSCC, head and neck squamous cell carcinoma; STAD, stomach cancer; COAD, colon adenocarcinoma; CHOL, cholangiocarcinoma; PAAD, pancreatic adenocarcinoma; TPM, transcripts per million; TCGA, The Cancer Genome.

