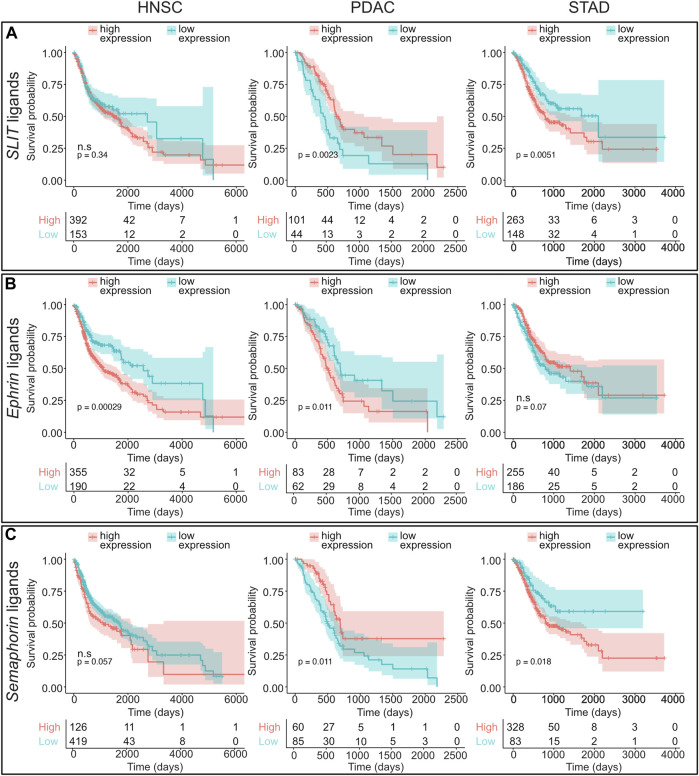
FIGURE 7.
Survival analysis of axon guidance gene families analyzing cohorts of paralog genes. Kaplan–Meier plots and number of patients at risk are shown which visualize HNSCC, PDAC, and STAD overall survival based on combined expression levels for the following paralog gene families: (A) SLIT ligands (SLIT1, SLIT2, and SLIT3), (B) EPHRIN ligands (EFNA1, EFNA2, EFNA3, EFNA4, EFNA5, EFNB1, EFNB2, and EFNB3), and (C) semaphorin ligands (SEMA3A, SEMA3B, SEMA3C, SEMA3D, SEMA3E, SEMA3F, SEMA3G, SEMA4A, SEMA4B, SEMA4C, SEMA4D, SEMA4F, SEMA4G, SEMA5A, SEMA5B, SEMA6A, SEMA6B, SEMA6C, SEMA6D, and SEMA7A). For this analysis, patients were segregated in two cohorts (low and high ligand expression) based on the most significant cut-off value for the combined genes. Low- and high-expression groups are depicted in blue and red curves, respectively. Abbreviations: HNSCC, head and neck squamous cell carcinoma; PDAC, pancreatic ductal adenocarcinoma; STAD, stomach adenocarcinoma; ns, not significant.

