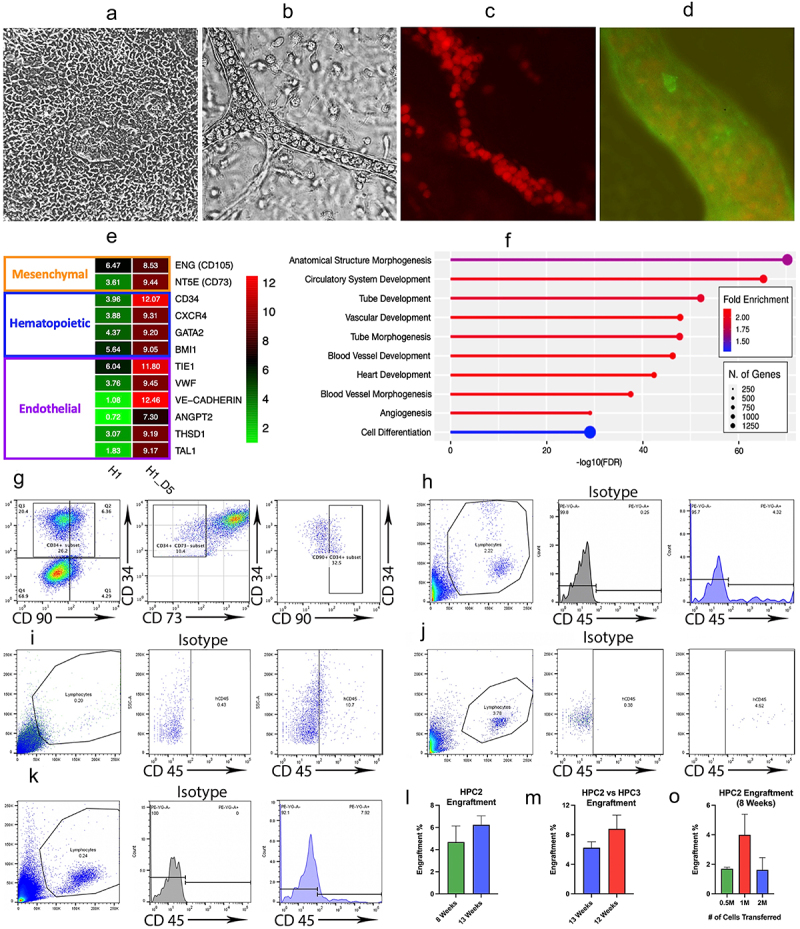
Figure 2.

Hematopoietic Progenitor Cell Characterization and Transplantation Experiments.
a. Phase contrast (PhC) image of monolayer progenitor population at Day 5 of differentiation. b. PhC image showing a vessel within the vascular organoid. c. Immunohistochemistry image showing the vascular organoid. Hematopoietic progenitor cells expressing CD43 develop inside of a tubular structure. d. The tubular structures of the organoid are formed by endothelial cells (stained for VE-Cadherin). e. Heatmap showing significant up-regulation in endothelial and hematopoietic gene expression of Day 5 progenitors, compared to hPSC control. f. ShinyGO functional enrichment tool showing that the most significantly up-regulated genes in Day 5 progenitors are predominantly affiliated with hematopoietic processes. g. Flow cytometry images demonstrating that cells from Day 5 of CHIR differentiation exhibit a CD34+CD90+CD73− engraftment signature. h. Flow cytometric analysis, conducted at 8 weeks post-injection, showing the percentage of human CD45+ cells generated by hematopoietic progenitor cells at time point 1 (HPC1). i. Flow cytometric analysis, conducted at 21 weeks post-injection, showing the percentage of human CD45+ cells generated by HPC1. j. Flow cytometric analysis, conducted at 8 weeks post-injection, showing the percentage of human CD45+ cells generated by hematopoietic progenitor cells at time point 2 (HPC2). k. Flow cytometric analysis, conducted at 12 weeks post-injection, showing the percentage of human CD45+ cells generated by hematopoietic progenitor cells at time point 3 (HPC3). l. A graph demonstrating a trend toward an increasing percentage of engrafted HPC2 (from week 8 to week 13). Bars represent mean ± SEM from at least three independent experiments. m. A graph demonstrating that there is no significant increase in engraftment potential at time point HPC3 compared to HPC2. Bars represent mean ± SEM from at least three independent experiments. o. A graph demonstrating no significant increase in engraftment potential when increasing the number of injected cells from 0.5 million to 2 million. Bars represent mean ± SEM from at least three independent experiments.
