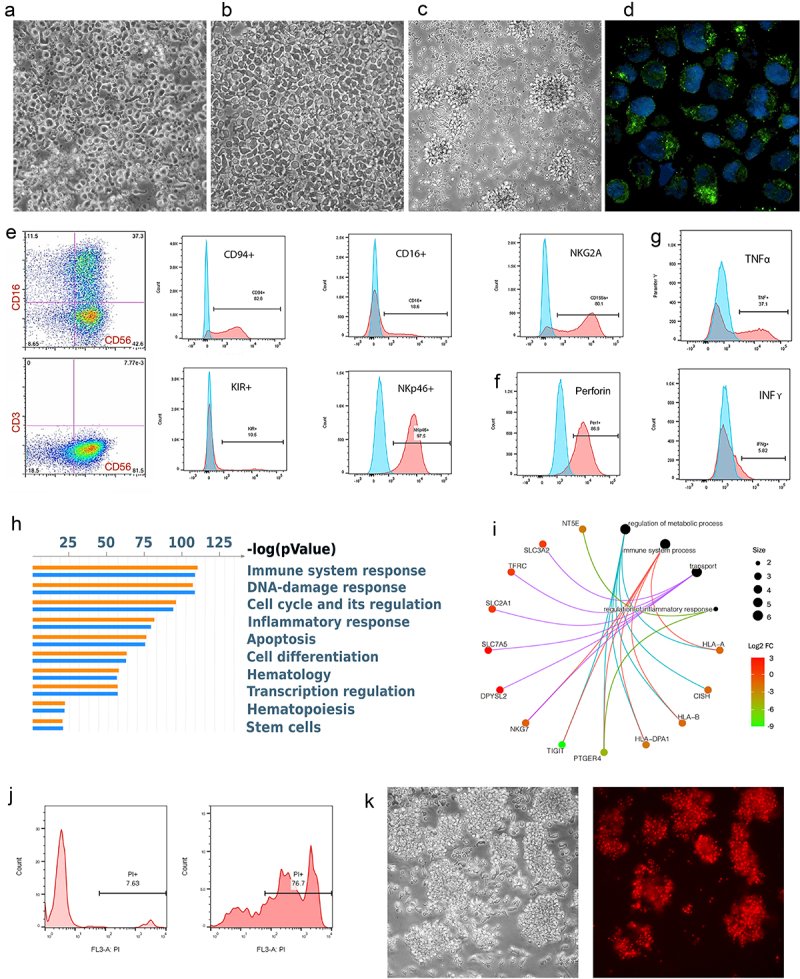
Figure 3.

hPSC-NK Cell Characterization.
a. PhC image showing the morphologic appearance of hPSC-NKs. b. PhC image showing the morphologic appearance of PB-NKs. c. PhC image showing the morphologic appearance of activated hPSC-NKs. d. Immunofluorescent image demonstrating granules containing Granzyme B (green) within the cytoplasm of hPSC-NKs. DAPI (blue) is used to visualize cell nuclei. e. Flow cytometric analysis showing CD56, CD16, CD94, NKp46, and NKG2A hPSC-NK marker expression. f. Flow cytometric analysis showing high expression of perforin in hPSC-NKs. g. Flow cytometric analysis demonstrating hPSC-NK production of cytokines, TNFα, and IFNγ. Cells were stimulated with PMA/ionomycin in the presence of Brefeldin A (overnight), fixed, permeabilized, and stained for TNFα or IFNγ. h. MetaCore analysis demonstrating the top 50 statistically significant functions among PB-NKs and hPSC-NKs. i. A category network plot showing statistically significant genes (RNA-Seq) that play an important role in NK cell anti-tumor response. j. Flow cytometric analysis showing that hPSC-NKs exhibit high cytotoxicity against K562 cells; PI = propidium iodide. k. PhC image (left) of Jurkat cells co-incubated with hPSC-NKs for 2 hrs. PI staining (right) showing that the majority of Jurkat cells are non-viable.
